Fama and French Three Factor Model of Assets PricingThe traditional asset pricing model, CAPM (Rpt) = Rf +Bp[(Rmt) - Rf], uses only one variable, Bp, to describe the returns of a portfolio or stockwith thereturns of the market as a whole. In contrast, the Fama–French model uses three variables. Fama and French started with the observation that two classes of stocks have tended to do better than the market as a whole: (i) the portfolio based of firm size (small caps and big caps) and (ii) portfolio based on M/B (market/book) ratios (stocks with a high book-to-market ratio (customarily called value stocks, contrasted with growth stocks)). They then added two factors to CAPM to reflect a portfolio's exposure to these two classes: (Rpt) = Rf +Bp[(Rmt) - Rf] + sp(SMB) + hp(HML) + εpt, Should rewrite the equation: (Rpt) -Rf = εpt +Bp[(Rmt) - Rf] + sp(SMB) + hp(HML), There are three factors • [(Rmt) - Rf] - market size premium; • SMB = • HML = Βp- is the sensitivity of the asset returns to market returns, sp, - is the sensitivity of the asset returns to return of SMB. It is the coefficient loading for the excess average return of portfolios with small equity class over portfolios of big equity class. hp - is the sensitivity of the asset returns to return of HML. It is the coefficient loading for the excess average returns of portfolios with high book-to-market equity class over those with low book-to-market equity class. εpt - is the error term for portfolio p at time t. hp, sp, coefficients are determined by linear regressions and can take negative values as well as positive values. The Fama-French three factor model explains over 90% of the diversified portfolios returns, compared with the average 70% given by the CAPM (within sample). The signs of the coefficients suggested that small cap and value portfolios have higher expected returns—and arguably higher expected risk—than those of large cap and growth portfolios. 83. Duration concept, application, concept of convexity, and how convexity affects macalay’s duration 83. Duration concept, application, concept of convexity, and how convexity affects macalay’s duration Duration: A measure of the sensitivity of the price (the value of principal) of a fixed-income investment to a change in interest rates. Duration is expressed as a number of years. Rising interest rates mean falling bond prices, while declining interest rates mean rising bond prices. There are two types of duration. McCauley Duration shows average term (in years) of payments to serve and repay the debt, weighted upon their discounted value. Macaulay duration is the name given to the weighted average time until cash flows are received, and is measured in years. Macaulay duration is a time measure with units in years, and really makes sense only for an instrument with fixed cash flows. For a standard bond the Macaulay duration will be between 0 and the maturity of the bond. It is equal to the maturity if and only if the bond is a zero-coupon bond. When yields are continuously-compounded Macaulay duration and modified duration will be numerically equal. When yields are periodically-compounded Macaulay and modified duration will differ slightly, and in this case there is a simple relation between the two. Modified duration is used more than Macaulay duration. Macaulay duration is the weighted average maturity of cash flows. Consider some set of fixed cash flows. The present value of these cash flows is:
where: · i - indexes the cash flows, · PVi - is the present value of the i-th cash payment from an asset, · ti-is the time in years until the i-th payment will be received, · V-is the present value of all cash payments from the asset. The Macaulay duration will equal the final maturity if and only if there is only a single payment at maturity. In symbols, if cash flows are, in order, Modified Duration shows sensitivity of bond’s dirty price (the price which includes the interest which haven’t been paid yet) to changes in yield. In other words it shows how much a bond’s dirty price will change, if yield (interest rates) changes to a certain extent. Modified duration is the name given to the price sensitivity and is the percentage change in price for a unit change in yield. Modified duration, on the other hand, is a derivative (rate of change) or price sensitivity and measures the percentage rate of change of price with respect to yield. The concept of modified duration can be applied to interest-rate sensitive instruments with non-fixed cash flows, and can thus be applied to a wider range of instruments than can Macaulay duration. The formula is:
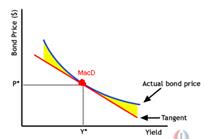
where YTM-yield to maturity, n – frequency of coupon payment within a year, P – dirty price, ∆P – change of dirty price, ∆YTM – change in yield to maturity. Convexity.D uration is linear a measure of how the price of a bond changes in response to interest rate changes. As interest rates change, the price does not change linearly, but rather is a convex function of interest rates. Convexity is a measure of the curvature of how the price of a bond changes as the interest rate changes. Specifically, duration can be formulated as the first derivative of the price function of the bond with respect to the interest rate in question, and the convexity as the second derivative. For any given bond, a graph of the relationship between price and yield is convex. This means that the graph forms a curve rather than a straight-line (linear). The degree to which the graph is curved shows how much a bond's yield changes in response to a change in price. If we graph a tangent at a particular price of the bond (touching a point on the curved price-yield curve), the linear tangent is the bond's duration, which is shown in red on the graph below. The exact point where the two lines touch represents Macaulay duration.
84. Valuation based on Price Multiples: P/E, P/BV, P/S. The P/E ratio (price-to-earnings ratio) of a stock (also called its "P/E", or simply "multiple") is a measure of the price paid for a share relative to the annual net income or profit earned by the firm per share.[2] Unlike EV/EBITDA multiple, P/E reflects the capital structure of the company in question. P/E is a financial ratio used for valuation: a higher P/E ratio means that investors are paying more for each unit of net income, so the stock is more expensive compared to one with lower P/E ratio. The P/E ratio has units of years,[note 1] which can be interpreted as "number of years of earnings to pay back purchase price", ignoring the time value ofmoney. In other words, P/E ratio shows current investor demand for a company share. The reciprocal of the P/E ratio is known as the earnings yield.[3] The earnings yield is an estimate of expected return to be earned from holding the stock if we accept certain restrictive assumptions (a discussion of these assumptions can be found here). P/E is not a useful measure of financial performance of a company, because stock prices are very sensitive to investor expectations about the future. P/E days little about a company’s current financial performance, but indicates what investors believe about future prospects. P/B is used to compare a stock's market value to its book value. It is calculated by dividing the current closing price of the stock by the latest quarter's book value per share, or the company's market capitalization can be divided by the company's total book value from its balance sheet. A lower P/B ratio could mean that the stock is undervalued. However, it could also mean that something is fundamentally wrong with the company. As with most ratios, it varies a fair amount by industry. Industries that require more infrastructure capital (for each dollar of profit) will usually trade at P/B ratios much lower than, for example, consulting firms. This ratio also gives some idea of whether you're paying too much for what would be left if the company went bankrupt immediately. P/B ratios do not, however, directly provide any information on the ability of the firm to generate profits or cash for shareholders. P/S is calculated by dividing a stock's current price by its revenue per share for the trailing 12 months, or by dividing the company's market cap by the company's revenue in the most recent year. The smaller this ratio (i.e. less than 1.0) is usually thought to be a better investment since the investor is paying less for each unit of sales. However, sales do not reveal the whole picture, as the company may be unprofitable with a low P/S ratio. Because of the limitations, this ratio is usually used only for unprofitable companies, since they don't have a price/earnings ratio (P/E ratio).[1] The metric can be used to determine the value of a stock relative to its past performance. It may also be used to determine relative valuation of a sector or the market as a whole. PSRs vary greatly from sector to sector, so they are most useful in comparing similar stocks within a sector or sub-sector.
|
 - excess return of small stocks over big stocks, they measure the historic excess returns of small caps over big caps
 - excess return of high book-to-market stocks over low book-to-market stocks, they measure the historic excess returns of value stocks over growth stocks.
 Macaulay duration is defined as:
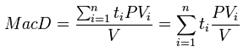
 , then:
  .
.