И.К.)Risky assets and portfolio optimization problem.Portfolio optimization is the process of changing the set of financial instruments held to meet various criteria most notably Financial risk The Portfolio Optimization template calculates the optimal capital weightings for a basket of investments that gives the highest return for the least risk. The unique design of the template enables it to be applied to either financial instrument or business portfolios. The ability to apply optimization analysis to a portfolio of businesses represents an excellent framework for driving capital allocation, investment, and divestment decisions. Key features of the Portfolio Optimization template include: - Ease and flexibility of input, with embedded help prompts. - Ability to specify the number of units held in each product or business stream. - Specify minimum and maximum constraints for the optimized portfolio. - Unique 'Maintain Current Return Level' option to ensure that return is not deteriorated at the expense of risk. - Ability to modify the correlation matrix and portfolio dynamics prior to the optimization process. - Set the analysis to calculate and account for downside risk only. Investment is a forward looking activity, and thus the covariances of returns and risk levels must be forecast rather than observed. Portfolio optimization assumes the investor may have some risk aversion and the stock prices may exhibit significant differences between their historical or forecast values and what is experienced. In particular, financial crises are characterized by a significant increase in correlation of stock price movements which may seriously degrade the benefits of diversification. Modern portfolio theory (MPT) is a theory of investment which attempts to maximize portfolio expected return for a given amount of portfolio risk, or equivalently minimize risk for a given level of expected return, by carefully choosing the proportions of various assets. MPT is a mathematical formulation of the concept of diversification in investing, with the aim of selecting a collection of investment assets that has collectively lower risk than any individual asset. That this is possible can be seen intuitively because different types of assets often change in value in opposite ways. For example, as prices in the stock market tend to move independently from prices in the bond market, a collection of both types of assets can therefore have lower overall risk than either individually. But diversification lowers risk even if assets' returns are not negatively correlated—indeed, even if they are positively correlated. Concept Investing is a tradeoff between risk and expected return. In general, assets with higher expected returns are riskier. For a given amount of risk, MPT describes how to select a portfolio with the highest possible expected return. Or, for a given expected return, MPT explains how to select a portfolio with the lowest possible risk (the targeted expected return cannot be more than the highest-returning available security, of course, unless negative holdings of assets are possible.) MPT assumes that investors are risk averse, meaning that given two portfolios that offer the same expected return, investors will prefer the less risky one. Thus, an investor will take on increased risk only if compensated by higher expected returns. Conversely, an investor who wants higher expected returns must accept more risk. The exact trade-off will be the same for all investors, but different investors will evaluate the trade-off differently based on individual risk aversion characteristics. The implication is that a rational investor will not invest in a portfolio if a second portfolio exists with a more favorable risk-expected return profile – i.e., if for that level of risk an alternative portfolio exists which has better expected returns. An investor can reduce portfolio risk simply by holding combinations of instruments which are not perfectly positively correlated (correlation coefficient)). In other words, investors can reduce their exposure to individual asset risk by holding a diversified portfolio of assets. Diversification may allow for the same portfolio expected return with reduced risk. 93. Mechanical methods of forecasting refer to technical analysis as a tool for forecasting. It is the method of forecasting, based on the study of past market data about the price, volume and open interest on stocks. One of the main characteristics of mechanical methods is the use of charts. Using charts, technical analysts identify price patterns and market trends in financial markets and attempt to exploit those patterns. The principles of technical analysis (mechanical methods) are: 1.Prices move in trend – prices trend directionally, i.e., up, down, or sideways (flat) or some combination. The basic definition of a price trend was originally put forward by Dow Theory; 2.History tends to repeat itself -technical analysts believe that investors collectively repeat the behavior of the investors that preceded them. To a technician, the emotions in the market may be irrational, but they exist. Because investor behavior repeats itself so often, technicians believe that recognizable (and predictable) price patterns will develop on a chart; Most widely used methods and techniques are: 1. 1. ‘A search for momentum’ –is the technique which uses the hi-lo chart (is the chart of lines connecting the high and low prices for the day to examine trends in the prices, the crossbars indicate closing prices.
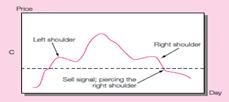
2. 2. The ’ head and shoulders’ chart – is named for its rough similarity to a portrait of a head with surrounding shoulders. Once the right shoulder is penetrated (known as piercing the neckline, когда правое плечо пересекает) it is believed the stock is on the verge(на грани) of a major decline in price.
3. 3.The Dow theory, named after its creator Charles Dow(is the grandfather of most technical analysis). The aim of the Dow theory is to identify long-term trends in stock market prices. The two indicators used are: 1. the Dow Jones Industrial Average (DJIA)- the key indicator of underlying trends; 2. the Dow Jones Transportation Average (DJTA)- serves as a check to confirm or reject that signal. The Dow theory posits three forces simultaneously affecting stock prices: - The primary trend -long-term movement of prices(several months to several years). - Secondary or intermediate trends- caused by short-term deviations of prices from the underlying trend line. These deviations are eliminated via corrections, when prices revert back to trend values. - Tertiary or minor trends are daily fluctuations of little importance.
More recent variations on the Dow theory are the Elliott wave theory and the theory of Kondratieff waves. 4. Using MACD(moving average convergence /divergence) indicator - is used to spot changes in the strength, direction, momentum, and duration of a trend in a stock's price. It is a collection of three signals: - the MACD line =the difference between a "fast" (short period) exponential moving average (EMA), and a "slow" (longer period) EMA; - the signal line (or average line)- the EMA of the ACD line; -the difference (or divergence)- the difference between MACD and signal lines; The standard interpretation is to buy when the MACD line crosses up through the signal line, or sell when it crosses down through the signal line. A crossing of MACD line through zero provides evidence of a change in the direction of a trend. 5. Relative strength approach -compares stock performance over a recent period to performance of the market or other stocks in the same industry. If the ratio increases over time, the stock is said to exhibit relative strength because its price performance is better than that of the broad market and vise a verse. Such strength presumably may continue for a long enough period of time to offer profit opportunities. 6. The notion of resistance levels or support levels. These values are said to be price levels above which it is difficult for stock prices to rise, or below which it is unlikely for them to fall, and they are believed to be levels determined by market psychology. 7. Focusing on the volume of trading. The idea is that a price decline accompanied by heavy trading volume signals a more bearish market than if volume were smaller, because the price decline is taken as representing broader-based selling pressure. For example, the trin statistic (“trin” stands for trading index) equals 94. Non-mechanical methods of forecasting refer to fundamental analysis. The predictions are made basing on the analysis of the firm’s financial statements and health, its management and competitive advantages, and its competitors and markets. When applied to futures and forex, it focuses on the overall state of the economy, interest rates, production, earnings, and management. When analyzing a stock, futures contract, or currency using fundamental analysis there are two basic approaches one can use; bottom up analysis and top down analysis. Fundamental analysis maintains that markets may misprice a security in the short run but that the "correct" price will eventually be reached. Profits can be made by purchasing the mispriced security and then waiting for the market to recognize its "mistake" and reprice the security. Investors can use either a top-down or bottom-up approach: 1.The top-down investor starts his analysis with global economics, including both international and national economic indicators, such as GDP growth rates, inflation, interest rates, exchange rates, productivity, and energy prices. He narrows his search down to regional/industry analysis of total sales, price levels, the effects of competing products, foreign competition, and entry or exit from the industry. Only then he narrows his search to the best business in that area. 2.The bottom-up investor starts with specific businesses, regardless of their industry/region. As a non-mechanical methods of forecasting also Behavioral models can be used. They make predictions integrate insights from psychology with neo-classical economic theory. (про behavioral models лучше не особо говорить, если увидите что просто fundamental analysis не очень убедил и комиссия спросит какие еще методы вы знаете, тогда можете попробовать всунуть про Beh.finance).
|


 trin is the ratio of average volume in declining issues to average volume in advancing issues. Ratios above 1.0 are considered bearish because the falling stocks would then have higher average volume than the advancing stocks, indicating net selling pressure.