Ex. I. Put questions to the underlined words.
Ex. 2. Read the text and translate it.
Ex. 3. Discuss the pros and cons of the bar types of charts.

TECHNICAL ANALYSIS PATTERNS
| Price Information: Open-High-Low-Close-OHLC
To accurately read the market, you only need four pieces of information: the Open, the High, the Low and the Close Price.
| Vocabulary
e to reflect — рассматривать
| |
| The Open Price
This is the price at which the first trade for the day takes place. Both buyers and sellers have had time to reflect upon the markets close on the previous day. Their perceptions will affect whether the stock opens higher or lower the next day. The subsequent price holds the clue as to which side of the market is the more dominant force — the buyers or the sellers.
The High Price
This refers to the highest price at which the security has traded that day. It is at this point that buyers decide not to push the price up any higher or alternatively, when sellers have gained control. If the high is at or near the opening of the day, that is a sign that the sellers have been the dominant force. If the high occurs near the end of the trading session and the open was near the low of the day, the buyers have had control.
| u: 'clue — ответ
| |
| Э:
to occur to gain control
| —
случаться — устанавливать контроль
| |
| The Low Price
|
|
|
| This refers to the lowest price at which the security has
|
|
|
| traded that day. At this point the sellers have decided not to accept a lower price or alternatively, when buyers have gained or regained control of the market.
If the low is near the opening of that day, that is a sign that
the buyers have been the dominant force. If the low is near the close of the day, that is a sign that the sellers are keen to sell and that therefore they have been in control.
The Close Price
The close is also sometimes called the sentiment. It is the
price at which the security is trading at the end of the day. This is the most watched price in analysis as it is seen as the final judgement on who won the day between the buyers and the sellers.
If the close is at or near the high of the day and the opening was near the low, it points toward a day of buying. An intra day chart would also reveal that prices were probably in an upward trending mode all day.
If the close is halfway between the high and low irrespective of the open, that is interpreted as the market being evenly divided. That is, that the buying power was balanced by the selling pressure.
| to be keen
| — быть заинтересованным
|
|
|
|
|
|
|
|
|
|
|
|
|
|
|
|
| e
|
|
| 'sentiment
| — настроение
|
|
|
|
|
|
|
|
|
|
|
|
|
| to win the day
| — добиться победы
|
|
|
|
|
|
|
|
|
|
|
|
|
|
|
|
| l
|
|
| 'irrespective of
| — независимо от
|
|
|
|
| | | | | | | | | |
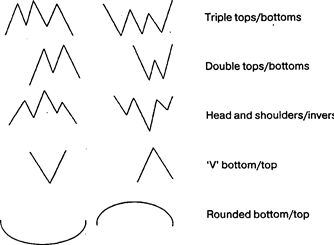
Price Patterns
Whether the market is ranging or trending, price movements are not always smooth. As a result price pattern identification is used to determine whether a market trend is intact or whether there exists the possibility of a reversal.
On the basis of chart formations significance to the current trend of the currency they fall into two categories: reversal patterns and continuation patterns.
Reversal patterns
A prerequisite for any reversal pattern is the presence of a trend.
Reversal patterns are often accompanied by a break in the trend line or pivot point. (The larger the pattern, the greater the significance.)
Head and Shoulders Reversal Pattern
The Head and Shoulders pattern is one of the most popular patterns but also one of the most difficult to identify. This pattern derives its name from its formation — which resembles a person. A true head and shoulders pattern will have the left and right shoulders roughly at the same height and distance from the head. The neckline should be almost level.
Head Голова
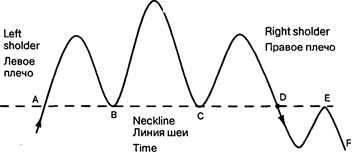
| Before A the neckline was a resistance line. Once it was
broken the resistance line turned into a support line. At points В and С the price bounced off it twice. The neckline was broken in point D and the trend reversed. A retest took place at point E.
The neckline was a resistance line again. The resistance point held, and the price declined to the level of F, the price target of the head and shoulders formation.
In an uptrend Left Shoulder represents a correction. If it
takes place — traders may take profits. Trend is still intact.
The Head indicates: that prices move up and surpass the
high of the left shoulder (Climax), but then move down again.
This places the upward trend in question.
Rieht Shoulder represents a retest. Buvers re-emerge and
price starts to go up again. If price moves up to the same level of the left shoulder or if it retraces 50% from the Head to the ootential neckline — the rieht shoulder is complete. It is an indication that a down trend is in place.
There are various analysis regarding the role volume plays
with Head and Shoulder patterns. In an uptrend some maintain that the left shoulder carries the hiehest volume, that volume, decreases at the Head and then falls substantially by the right shoulder. Others maintain that the volume is highes at the Head and has a greater decline in the right shoulder.
When the market moves out of a Head and Shoulders
pattern to the upside, it must have high volume.
|
|
|
|
|
|
| au
|
|
| to 'bounce off -
| - отскакивать
|
|
|
|
|
|
|
| a.
|
|
| 'target
| - цель, точка движения цены
|
|
|
|
|
|
|
|
|
|
|
|
|
|
|
|
|
|
|
|
|
|
|
|
|
|
|
|
|
|
|
|
|
|
|
|
|
|
|
|
|
|
|
|
|
|
|
|
|
|
|
|
| Time
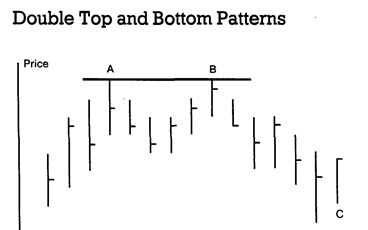
Double tops and bottoms are more common than (but not as significant as) triple tops and bottoms. A double top is referred to as an M, while a double bottom is termed a W. Double top and double bottom patterns are fairly common on price charts, but are often ovemsed. In a double top, a new high is set on strong volume, then volume subsides as prices decline. On the ensuing rally, prices climb back to the first high, but fail to close above this level, and prices begin to fall again. (C) At this point, there is only a potential double top. It is not confirmed until prices close below the first low, usually on strong volume.
|
sju: ensuing — следующий
i: to exceed — превышать
u: 'crucial — решающий, важный
ei prevailing — господствующий
|
After a settlement under this low has been recorded, prices should continue to move a distance equal to the height from the original high to the first low. The same is true for double bottoms, but in the opposite direction. A variation of this pattern is the triple top (and triple bottom). This begins like the double top, but instead of the second correction breaking the first low, prices rally from this point back to the original high. Then, on the third correction, if prices close below the two previous lows, the pattern is complete. The measuring objective is identical to the double top. These patterns often occur at major tops and bottoms, and often exceed the original target by a substantial amount. It is cmcial, though, to wait until prices settle below the first low. Clearly, a breach of the highs in a potential top, or the lows in a potential bottom will leave this looking like a breakout in the direction of the prevailing trend, and rectangle/ consolidation area breakout would be in action, potentially a flag as well.
Rounding Tops and Bottoms

| A less frequent, but no less useful technical formation is the rounding bottom and rounding top. They are sometimes referred to as saucers and inverted saucers, respectively. As the name implies, a rounding bottom occurs when prices gradually shift from a downtrend to an uptrend to form a short of shallow "U" shape on the charts. To validate this formation, it is important that the volume also form a saucer formation: that is, volume should gradually decline as the downtrend ends, then slowly increase as prices begin to rise again. In a bottom formation, this type of price action represents accumulation — the "smart money" slowly adding to long positions. At tops, this formation represents distribution, or the "smart money" getting out of long positions and adding to short ones. A common variation of saucers is for prices to rise sharply and suddenly on strong volume near the mid-point of the formation. This activity only lasts a few sessions, after which prices fall back within the rounding pattern. It is difficult to determine exactly when the pattern is complete, but a good indication occurs when volume begins to increase sharply or prices break an important area.
| 0:
'saucer
ae 'shallow
ae to validate
smart money
| — блюдцо, соусник — мелкий
— узаконить, сделать действительной
— вложение денег без риска, используя секретную информацию
|
Comprehension Questions
1. How many prices does the dealer need to know to read the market?
2. What affects the open price?
3. What does the high near the end of the trading session show?
4. Why is the close called sentiment?
5. What do price patterns indicate?
6. Which is the most popular reversal patterns?
7. What role does volume play with Head and Shoulders patterns?
8. Compare Double Top and Rounding Top patterns.
Exercises
Ex. 1. Put questions to the underlined words.
Ex. 2. Compare the reversal patterns and state their difference.
Ex. 3. Translate the dialogue from English into Russian in writing and from Russian into English orally.
Dialogue:
Client: What are the prerequisites of reversal patterns?
Broker: A prerequisite for any reversal pattern is the presence of a trend. A break in the trend line usually
accompanies a reversal pattern. The lai-ger the pattern, the greater the significance. CI: When does a retest in the Right Shoudler take place? Br: A retest is always a retest of the climax whether it be a top or a bottom. CI: What are the conditions for a retest of a climax?
Br: In a trending market there must be a rally. Market has a sharp turn down. New buyers start buying. CI: And the new buyers are not enthusiastic. Br: No, they are not. Declining volume and trading range confirm that. CI: When is the retest complete?
Br: The retest is complete if the buyers falter within the 50% region of the climax retest and price turns sharply down. A retest does not require the trader to wait for a break of the previous low pivot point.
TRANSLATION PRACTICE
New Concepts in Support and Resistance
Fig. 1

| There is an understandable tendency to look to see kev horizontal support and resistance levels tested when they are reapproached. Many traders tend to set profit targets referenced to such levels, and stops also tend to be positioned relative to breaches of these levels. This is all verv well but disappointment often results as the key support and resistance levels in a structure aren't necessarily the isolated highs and lows. Thus very often the market will reverse just short of these levels, much to the fury of many traders who'd been counting the pennies before they were securely in the till! Consider the stylised bar chart in figure 1, areas (A) and (B) represent a two period reversal stmcture that is commonly seen in the markets. Taking the highlighted (A) area first, the bulls would have been well contented at the close of the period (close "C"). However, they were due for a shock, as whilst the market did push higher to begin with in the next period (sucking more weakly committed bulls in), by the close (close "D") there were a lot of unhappy and damaged traders around. The high of the first period "b" constitutes a much more potent resistance level when retested, than the actual isolated high of the structure marked "a". This is not to say that "a" won't be attacked, but time and again you'll find it's "b" where the real battle is fought, and where the subsequent reversal or
| Vocabulary
to set targets — ставить цели
ja fury — бешенство
till — касса
л to suck in — всасывать
ou 'potent - сильный
|
| consolidation will be initiated. In the practical sense one could say "b" is more significant than "a" due to a greater degree of market confidence at "b", and it is almost certainly associated with higher volume. There is however another way of looking at it, which I call the "Concept of Maximum Bearishness/Bullishness".
Maximum Bearishness/Bullishness
If in the first highlighted period of (A) the bulls had been
totally in control, with the bears utterly routed, then the close of
the period would have been at "b", the period high. One can
look at this pullback from the high — the difference between "b"
and "с" — as representing the ability of the bears to fight back.
Similarly in the second oeriod of (A) the orice difference
between "d" and "e" represents the ability of the bulls to fight
back after being mauled. The way to evaluate which is the period of maximum bullish strength in any structure (which is where the bulls had maximum control) is to sweep back these differences (the pullback from the high) through the respective closes and compare the levels obtained. This is the concept of SWEEP and it is the period with the highest sweep level that constitutes maximum bullishness.
The high of this maximum bullish period is a key resistance. I think it can be easily seen that reflecting "b"—"c"
back through "c" gives a much higher level than reflecting "a"—"d" back through "d". Thus it's the first period of (A) and its high "b" that qualifies as the maximum bull point not point "a", despite it being higher. Note the maximum bull period may indeed be the one that includes the actual isolated high (area (D)
is such an example).
Resistance Level Strength
Price action as depicted in (A), being a two period bull
reversal structure, needs to be viewed in light of the above if, or when, the market returns to the same level. There are a couple of tests that can be applied to make a judgement on how potent the resistance level "b" is likely to prove:
1. Reflect the "sweep" movement of the price curve points
"b"-"c" down through "c" and "d"-"t" up through "d". Do
the two levels cross or are they able to "hold hands" as I term it?
If they do not, it's a measure of how many people have been
caught and how badly they've been caught. It is the pain and distress that materialises from a reversal level that directly and strongly influences how potent it will prove at a later time. If the reversal was violent, closing on or near the low of the period and thereby giving the majority in a bad position little or no time to get out, then "b" will return to "haunt" the market if the level is re—attained — pain is remembered even if only subconciosly!
2. Look at the price action following the reversal period,
did it make a fair job of re-tracing before going down again, or did the market just plummet? If it's the former then "b" won't be nearly so key a level than if we get a nose dive. Again it comes back to giving traders an opportunity to get out when wrong without a serious loss. Remember a violent one-way market means somebody somewhere is in distress!
| au
|
| to rout — разгромить
|
|
|
|
|
|
|
|
|
|
|
| о:
|
| to maul — калечить, бить
|
|
|
|
|
|
|
|
|
|
|
|
|
|
|
| to hold hands — занимать выжидательную
|
| политику
|
|
|
|
|
|
|
|
|
|
|
|
|
|
|
| e distress — горе
|
|
|
|
|
|
|
|
|
|
|
|
|
| pain — боль
|
|
|
|
|
|
|
|
|
|
|
|
|
|
|
| О'.
|
| 'to haunt - преследовать
|
|
|
|
|
|
|
|
|
|
|
|
|
| л
|
| to 'plummet — резко упасть
|
|
|
|
|
|
|
Exercises
Ex. 1. Put questions to the underlined words.
Ex. 2. Find verbal constructions and state their syntactical function in the sentence.
Ex. 3. Select sentences which present difficulties for translation and make a syntactical analysis of them.
Ex. 4. Draw up a plan of the article.
Ex. 5. Enact an imaginary dialogue between the author and a dealer on support and resistance.

TECHNICAL ANALYSIS PATTERNS (CONTINUED)
| Continuation Patterns
(TRIANGLES, PENNANTS, FLAGS,
WEDGES,RECTANGLES)
| continuation patterns
- фигуры продолжения
- Vocabulary
|

|
| Э:
|
|
| Continuation patterns confirm the continuation of an existing trend. They indicate that a sideway price movement is only a pause in the prevailing conditions.
| 'pause e
| - пауза, отдых
|
| Triangles
| ascending
| - восходящий
|

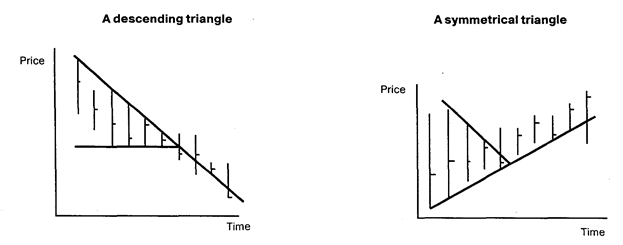
The ascending and descending triangles are price patterns that occur on bar charts and are similar in many respects to the more familiar symmetrical triangle. An ascending triangle is formed by a high. a low, a second high approximately equal to the first high, and a second low which is higher than the first low. For a descending triangle the situation is reversed. This pattern forecasts future price movement because prices are expected to break in the direction of the two equal price levels (to the high side on ascending triangles, and to the low side on descending triangles). In order for the pattern to be valid, two important conditions must be met:
1. Volume and open interest should decline as the triangle forms.
2. The breakout should occur between 1/2 to 3/4 of the distance from the start of the pattern to the apex.
When a breakout occurs, prices should continue in the same direction by an amount equal to the distance from the highest high in the triangle to the lowest low. The symmetrical triangle is seen when highs become lower and lower, and lows become higher and higher, with the resistance and support lines converging. This must be done in nearly a horizontal trend to avoid forming a wedge. Keep in mind that triangles are quite often continuation patterns, see Flags.

| A wedge pattern on bar charts is similar in certain respects
to a symmetrical triangle formation (in fact triangles are some times referred to as wedges). However, wedees have distinct features from triangles: A rising wedge is characterized by a high, a low, a higher high and a higher low. This will give the appearance of an uptrend, but in a wedge the line connecting the highs and the line connecting the lows converge, whereas in a channel they will remain more or less parallel. In a triangle, either the highs or the lows are roughly equal, or else the convergence takes place
with no trend implications, as in a symmetrical triangle. It is rising, or falling, nature of the wedge that separates it from the triangle formation.
Wedges form most often as a counter-trend consolidation
area. This means that during a strong downtrend, a rising wedge will sometimes form as a corrective pattern before the down trend resumes. Thus, a rising wedge has bearish implications, and a falling wedge has bullish implications. After the wedge forms, a breakout is confirmed when prices break the corresponding trendline the lower one in a rising wedge and the upper line in a falling wedge. After the breakout, prices should travel at least as far as the starting point of the formation.
Rectangle
|
|
| Э:
|
|
| converge
| — сходятся
|
|
|
|
| ei
|
|
| implication
| — то, что подразумевается
|
|
|
|
| e
|
|
| rectangle
| — прямоугольник
|
|
|
|
|
|
|
| о
|
|
| to resolve
| — разрешаться, решаться,
|
|
| формироваться
|
|
|
|
|
|
|
| u:
|
|
| clue
| — указание, наметка
|
|
|
|
| ae
|
|
| to validate
| -узаконить
|
A common consolidation pattern that occurs on price charts is the rectangle. This technical formation usually occurs at the end of a strong market move, either an uptrend or downtrend, and typically represents a pause in the action. A rectangle is also known as a trading range or a consolidation and is easy to observe because price movements are clearly confined by two parallel lines. A rectangle normally is resolved as a continuation pattern, see Flags. This means that prices should continue in the direction they were moving before the consolidation began. Another clue to the direction of the breakout is the volume pattern within the rectangle. If volume is stronger during the rallies than on the declines, the upside breakout is more probable. The measuring objective after a breakout is determined by the height of the trading range. This distance is added to the level of the breakout point to reach a minimum objective. Similar to a triangle pattern, strong volume is necessary on an upside move to validate the breakout. It is not necessary for a downside breakout.
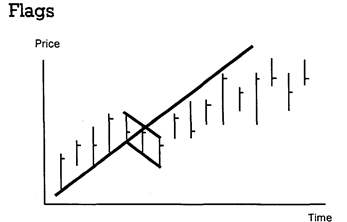
| One of the most reliable of all technical formations is the
flag or pennant pattern. These patterns are very similar. Both are formed after a sharp, straight-line move that occurs on heavy volume (either up or down). After the move. a flag is formed by a short, choppv consolidation period. This consolidation is bounded by two parallel lines (rectangle). A pennant is formed after a strong move during a short consolidation period that resembles a small triangle or wedge. Flags and pennats are almost always continuation patterns, and are confirmed when volume
declines during the consolidation, then prices break the respective consolidation trendlines on strong volume (i.e., the upper boundary line after an up move, and the lower boundary line after a down move). After the breakout, prices should continue moving by an amount equal to the move that preceded the brief consolidation. In this respect, flags and pennants are said to "fly at half mast". The beginning of the move is usually the point where prices broke out of another chart pattern, or breached important trendline support or resistance.
Pennants
A pennant is a fairly common formation, sharing most of
its characteristics with flags. Both are formed in dynamic markets. with a "flagpole" formed by an impulsive almost straight line move. A brief period of consolidation results to form the pennants "mast", which is shaped like a small symmetrical triangle. Thereafter, prices move in the direction of the initial impulsive move and for a similar distance, i.e. the mast evolves halfway through the move. Thus to measure the distance of the total move, the length of the flagpole up to the mast is measured and projected from the breakout point of the pennant.
|
|
|
|
| э
|
| 'choppy — часто меняющийся
|
|
|
|
|
| i:
|
| precede — предшествовать
|
|
|
| to fly at half
|
| mast — приспущенный флаг
|
|
|
|
|
| э
|
| evolve — развертываться,
|
| эволюционировать
|
|
|
| е
|
| project — проектировать
|
|
|
|
|
|
|
|
|
|
|
|
|
|
|
|
|
|
|
|
|
|
|
| Gaps
Consecutive transactions can be dealt at significantly different prices. Price gaps that occur within a day's trading do not show up on a bar graph because the graph will show the range for the day. However, if the closing high on one day is below the low of the next day (or one day's low is above the next day's high), a gap actually shows on the bar graph. There are four basic kinds of gap. One, the runaway gap. reflects a continuation of the move. A runaway gan appears after a significant move has already occured. In indicates that the move has received a second wind and is ready to go higher with relative ease. The runaway gap frequently occurs approximately halfway along a major move. Common Gap
|
e consecutive
л runaway
as 'gap
a second wind
|
последующий — убегание
— скачок усиление
|

| Two of the other three kinds of gap, the common gap and
the breakaway gap, are important in terms of market reversals.
The common gap materializes on one day but subsequently gets filled in. It often is nothing more than the result of thin markets.
It is viewed by most practitioners as a false signal, although it can be an indication that the market is leaning to break out in the direction of the gap.
The breakaway gap frequently occurs at the end of a con
Solidation phase, at the end of a key price pattern, or after a major support, or resistance line has been broken. It usually represents the beginning of a fairlv major move. A breakaway gap is often sharp because those with wrong positions not only will get out of the bad position they are in, but will also establish positions in line with the market move. A breakaway gap may get partially filled in, but mot totally.
The fourth kind of gap. an exhaustion gap, occurs near the
end of the market move. The market tries to jump forward, but there is little support for the move, and the market quickly retraces. When prices come back through the gap, it is a fairly reliable barometer that the move is over. The exhaustion gap often correlates to the period when small players enter the market.
When that happens, in is another signal to be a contrarian and to expect the market to reverse.
|
|
|
| in line with
| — в соответствии с
|
|
|
|
|
|
|
|
|
|
| ei
|
|
| retrace
| — возвращаться по пройденному
|
|
| пути
|
|
|
|
|
|
|
|
|
|
| Э:
|
|
| correlate
| — соответствовать
|
|
|
|
|
|
|
|
|
|
| еэ
|
|
| contrarian
| — идущий от противного
|
|
|
|
|
|
|
| to fill
| - наполнять
|
|
|
|
Islands
Islands are an even more extreme example of a change in market sentiment giving a sharp reversal. An island is formed by at least two gaps. In an uptrend reversal, the first gap is a "break away" as the market opens higher than the previous time periods high, and maintains that gap. The gap is never "filled" in that at least one entire time period is traded above the gap. The reversal occurs when prices fall sharply in a subsequent period, whether it be the next period or many later. The drop has to gap through, leaving an island of price activity clearly defined by at east two gaps, one up, one down. The reverse is tme in a turn of a bear market. Futures markets sometimes have gaps. while 24-hour foreign exchange markets tend to see them less frequently. When seen though, they can be powerful indications of a trend change.
Comprehension Questions
1. What do continuation patterns show?
2. How are ascending and descending triangles for med?
3. How do wedges differ from triangles?
4. When do wedges form a counter trend consolidation area?
5. Why is a rectangle called a trading range?
6. Why is the flag, or pennant pattern one of the most reliable of all technical formations?
7. When does a gap usually show on the bar graph?
8. What kinds of gap do you know?
Exercises
Ex. 1. Put questions to the underlined words and let your partner answer them.
Ex. 2. Describe the market situation using the gaps chart.
Ex. 3. Read and translate the text.
Ex. 4. Select sentences which are difficult to translate and make a syntactical analysis of them.
TRANSLATION PRACTICE
New Concepts in Support and Resistance
In the spot Yen chart (figure 2) the reversal at a.) was violent, once the maximum bullish point was lost it was not seen again. This level later serves to top out a strong rally leaving high order isolated high (an isolated high that has several lower isolated highs in each side of it). Level b.) is nothing like so decisive. Look at the pullback from the high during the second period of the reversal. Level b.) acts as support and rebuffs a subsequent
| downward thrust, but it is not really potent — accordingly it gives up without much of a fight a little later.
c.) is similarly weak, and on eventual attack it gives way easily. d.) and e.), however, constitute strong support (d.) and resistance (e.) when retested, as here the potential for getting un-
| Vocabulary
ou 'potent — мощный
|

| pleasantly caught was high.
Finally we have the classic case of f.) where the reversal
sweeps "don't hold hands" and price rallies rapidly and decisively. Accordingly the max bear point level f.) serves to halt a subsequent strong downthrust.
The hourly Spot Stg chart (figure 2) shows four reversal
Levels that have one property in common, namely they each represent the period of maximum bullishness [b.) and c.)] and bearishness [a.) and d.)] of their structures. (Note the period of maximum bullishness/bearishness should always be looked for in any reversal or consolidation structure.) Whilst in the great majority of cases it is constituted by an isolated high or a two period reversal of the type discussed (high and low of the first period depending on direction of reversal), this is not always the
case. Sometimes this point can be "cunninglv" hidden amongst the oscillating price action (eg. "c" in the Stg Hourly chart) yet it will still represent a key level if the area containing it is re-challenged.
How long do these horizontal support/resistance levels
maintain their influence?
When price action reaches key levels it is more common to find price stalling than rushing straight through like a runaway train. This stall mav precipitate a reversal or a consolidation. where the market gathers itself for a decisive push through the price obstacle(s) that has temporarily balked it. When price breaches support/resistance it weakens it, even if by the close we
have returned back through the level.
| To precipitate - ускорять
|
|
|
|
|
|
|
|
|
| to hold one's
|
| hand — воздерживаться от действий, занимать выжидательную позицию
|
|
|
|
|
|
|
|
|
|
|
|
|
| to stall — задерживать
|
|
|
|
|
|
|
|
|
|
|
| ei
|
| failure — точка неудачи
|
|
|
|
|
|
|
|
|
| correlation — оказаться в соотношении
|

OSCILLATORS
| Key terms
|
|
| 1. oscillator
| — осциллятор — индикатор, который колеблется между верхней инижней границами коридора, обозначает сигналы «купи», «продай»,
указывая разницу между показателями среднего движения курса за
короткий и длинный периоды времени.
|
| 2. Momentum
| — осциллятор, указывающий на скорость изменения цены в сравнении с уровнем самой цены. Разница между ценой инструмента сегодня и
ценой в предшествующие периоды. Положительное или отрицательное значение разницы отмечается относительно нулевой линии.
|
| 3. Relative Strength Index (RSI)
| — осциллятор — индекс, обозначающий силу цены настоящей
относительно цены в прошлом.
|
| 4. Stochastics
| — индикатор скорости изменения цен. На растущем рынке цены при
закрытии биржи устремляются вверх, и наоборот, при понижательной
рыночной конъюнктуре они падают вниз.
|
| Slow stochastics
| — дает менее чувствительные показатели движения цен и более
предпочтителен для торговцев. Его показатель % К соответствует
% D быстрых стохастических линий.
|
| Fast stochastics
| — индикатор более чувствительный, чем медленные стохастические
линии, линия % показывает близость цен закрытия биржи к верхней
границе за определенный период. Масштаб измерения — от 0 до 100.
Наивысшая цена — 100, самая низкая — 0. % D — вторая линия,
специальная линия показателей среднего движения курса % К по
различным периодам. Сигнал покупки образует комбинация низкого
значения % D и еще более низкого значения % К (менее 20).
Сигнал продажи — высокое значение % D и еще более высокое
% К (более 80).
|
| 5. Moving Average Convergence
Divergence (MACD)
| — две линии показателей среднего движения курса, колеблющиеся выше и ниже нуля. Первая линия (Conv.) отмечает разницу между
показателями среднего курса (MACD W), а вторая является
экспонентным показателем среднего курса первой линии (MACD), т.е.
сигнальной линией. Если MACD W пересечет сигнальную линию
сверху, то возникает сигнал покупки. Если пересечение произойдет с
противоположной стороны — то возникает сигнал продажи. Чем
пересечение дальше от нуля, тем прогноз надежнее.
|
| 6. Moving Average Crossover
| — пересечение скользящих средних с коротким и длинным периодом образует две линии показателей среднего движения курса.
Если курс с коротким периодом падает ниже курса с длинным периодом и оба курса снижаются, то образуется сигнал продажи. Если курс короткого периода пересекает курс длинного периода снизу и оба курса поднимаются вверх, то образуется сигнал покупки.
|
| 7. Bollinger Bands
| — линии, наносимые на график выше и ниже скользящей средней цен
закрытия. Верхняя и нижняя линии сближаются при спокойной
конъюнктуре рынка и расходятся с ростом колебания цен.
|
| 8. Directional Movement Index —индекс, образуемый четырьмя индексами и указывающий на силу
тренда.
|
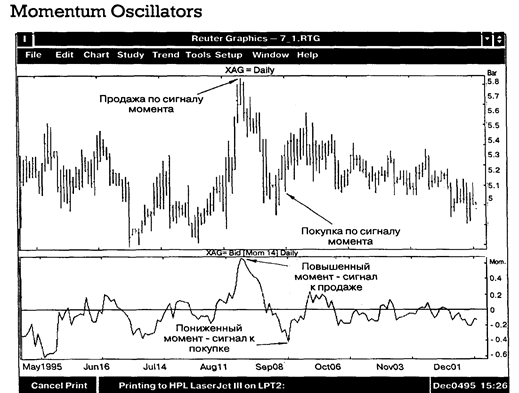
| Momentum oscillators are technical indicators which measure the change in prices over a given time period. These indicators are very useful in trendless or sidewavs trending markets, as well as in trading band conditions. They can also help in oinoointing the turn in trends, whether they be intra-day, weekly, or very long term in nature. During a trending period though, the trend will tend to dominate any signals given by the momentum oscillator. There are three important indications to look for in all momentum oscillators: direction. extreme values and divergence from prices.
Direction
Momentum oscillators track prices verv well. and can actually lead price direction bv one to two periods. The direction
| Vocabulary
ae 'value - ценность, цена, сумма
э: divergence - отклонение
i: to'lead - упреждать
crossover — пересечение
|
| that momentum oscillators are moving in thus corresponds to the direction in which prices will potentially move. Longer term versus shorter term momentum oscillator analysis provides indication of price direction as well. This is similar to the use of long and short term moving averages for determining nrice direction, in that cross overs are very important. A longer term momentum oscillator is one that uses a larger time period. relative to a medium term momentum oscillator. For example, a 21-day Stochastic would be considered a long term momentum oscillator, compared to a 9-day stochastic, and a 10-bar hourly stochastic would be considered a longer term stochastic in comparison to a 5-bar hourly stochastic. As a rule: "The longer term momentum oscillators have less volatility and thus they will not be subject to the number of false
|
| signals that the shorter term momentum oscillators are,
making a case for using them in conjunction with each other.
The same effect can be generated bv smoothing a same
time period oscillator, in effect slowing it down. In this case, a moving average of a momentum oscillator can be compared to the underlying momentum oscillator, and give similar cross over signals as using the longer term/shorter term indicators.
Extreme Values
An extreme value in the momentum oscillator occurs,
when peaks and troughs are evident in the momentum oscillator chart. When the momentum oscillator reaches an extreme value, the trend in prices will generally flatten, and there is potential for a reversal of the prior trend. However, the prevailing trend of price direction is still the major trading
factor, and momentum oscillators reaching extreme values is usually a pause in the trend. Areas of extreme value are called overbought levels at momentum oscillator peaks, and oversold levels at momentum oscillator troughs. Both the Relative Strength Index and the Stochastic indicator have predetermined levels where the underlying instrument is considered to be overbought or oversold, but as peaks tend to occur at higher levels in bull markets, troughs at lower levels in bear markets, the use of predetermined levels for overbought/oversold signals is not encouraged. Other momentum oscillators such as the Net Change Oscillator (NCO) or Rate of Change Indicator (ROC) display peaks and troughs as well, but there are no predetermined valuation levels which give overbought/oversold indications.
Divergence
As prices and momentum oscillators usually trend in the
same direction, and momentum oscillators can be used for the timing of price turns, divergence in direction is an important sianal. Divergence occurs when prices continue to trend higher (or lower) and momentum oscillators turn in the opposite direction. This is most significant at new price highs or lows, but keep in mind that chart patterns such as double tops, head and shoulders, etc. can occur when divergence is seen, and one should wait for penetration of kev suooort. or resistance, in order to confirm this turn in the trend. Divergence can be used to tighten stops, or as a strong warning signal that the prevailing trend could be reversing.
These three indications are verv important in using
momentum oscillators, as used in conjunction with each other thev can help in determining trends and turning points.
Moving Average Spreads (MAS)
The formula of the moving average spread is:
MAS = shorter moving average - longer moving average
Example: (4-day MA) — (18-day MA), or
(5-week MA) - (20-week MA).
Moving average spreads are derived by taking the
difference between two moving averages. Usually one of the moving averages is a short term moving average, while the other can be intermediate, or long term. This difference, or spread, is plotted and used as a momentum oscillator.
| л
|
|
| 'underlying
| - основной
|
|
|
|
|
|
|
|
|
|
|
|
|
|
|
|
| of
|
|
| 'trough
| — нижняя точка (поддержка)
|
|
|
|
|
|
|
|
|
|
|
|
|
|
|
|
| i:
|
|
| 'peak
| — высшая точка (сопротивления)
|
|
|
|
|
|
|
|
|
|
|
|
|
|
|
| QT dl
|
|
| 'prior
| — предшествующий
|
|
|
|
|
|
|
|
|
|
|
|
|
| e
|
|
| spread
| — разница, разрыв
|
|
|
|
|
|
|
|
|
|
|
|
|
|
|
|
|
|
|
| pre-set
| — заранее установленный
|
|
|
|
|
|
|
|
|
|
|
|
|
|
|
|
|
|
|
| ae
|
|
| 'magnitude
| — величина, значение
|
|
|
|
|
|
|
|
|
|
|
|
|
|
|
|
| to overlay
| — наложить
|
|
|
|
|
|
|
|
|
|
|
|
|
Moving average spreads are plotted as any momentum oscillator. Direction, extreme values and divergence are looked for in the chart. If the spread is uptrending, the shorter term moving average must be greater than (above) the longer term moving average. The reverse is true for a downtrending spread. Trading signals are generated when the zero line is crossed, showing a moving average cross over. Thus, moving average spreads are good trend indicators.
Extreme values are a little harder to measure in the moving average spreads as there are no pre-set boundaries. The Relative Strength Indicator and Stochastic Oscillator have maximum and minimum values (100 and 0) and levels at which the market is considered overbought/oversold (70% - 30% and 80%-20%, respectively). The MAS, much like the NCO, does not have either of these pre-determined parameters. It can take on any value, positive or negative, of any magnitude. Analysing historical data of past extreme values is necessary, and then these areas can be used for future reference.
Divergence between MAS direction and security price direction gives early indication of trend change. One measure of trend change that is often used in technical analysis is the crossing of moving averages. Crossing of the moving averages which make up the spread necessarily makes the MAS reach zero. Thus, early warning or confirmation of a change in trend is possible using MAS.
Comprehension Questions
1. What do momentum oscillators measure?
2. What are the three important indications in all momentum oscillators?
3. How do momentum oscillators show direction of price moves?
4. Which M. 0's produce false signals?
5. How can M. 0's indicate a reversal of the prior trend?
6. What are the areas of extreme value called?
7. When does divergence occur?
8. What is the formula of Moving Average Spreads?
Exercises
Ex. 1. Put questions to the underlined words.
Ex. 2. Find verbals and state their syntactical function in the sentence.
Ex. 3. Select sentences which are difficult to translate and make a syntactical analysis of them.
Ex. 4. Analyse noun collocations according to the models given in the Reference Grammar.
Ex. 5. Read and translate the text.
| TRANSLATION PRACTICE
Momentum Crossover Analysis
The Momentum Crossover analysis, which can be created in the User defined analysis modules of Reuters Technical Analysis and Reuters Technical Analysis for Unix, combines the trend direction characteristics of the simple moving average and the trend strength capabilities of the momentum analysis. Two of these analyses used together can produce effective buy and sell signals.
| Vocabulary
ou crossover
trend direction -
trend strength -
|
пересечение (трендов) - направление тренда -
сила тренда
|

| The formula parameters are as follows and need to be filled in at the time of charting: vl —timeseries (instrument), nl — observation period for momentum (lag period), n2 — averaging period for moving average. The diagram shows a short and long momentum crossover analysis giving clear buy and sell signals. The momentum crossover analysis is simply a smoothed version of the standard momentum analysis. Two of these analysis on the same chart, one with a long, the other with a short averaging period can be used in the same way as two standard simple movine averages, (i.e. crossover indicates buy and sell signals) except that the lines will oscillate around zero. Uptrends are indicated bv price action below the momentum crossover lines. The momentum crossover line cutting through price after a trend has been established (up or down) indicates trend reversal. The analysis should not be used in a sudeways market as it tends to be choppy in the same manner as ordinary moving averages. To create the Momentum crossover analysis, simply add the following formula into the UDA editor of either RTA or RTAu. Then graph the momentum crossover twice with differing length averaging and observation periods overlaid with a price chart. The momentum and moving average oeriod parameters
should be the same as those used for short and long moving average crossovers for the instrument you are trading.
Exercises
Ex. 1. Put questions to the underlined words. Ex. 2. Find verbals and state their syntactical function in th Ex. 3. Analyse noun collocations.
| e momentum — скорость изменения цены
moving average — скользящая средняя lag - отставание во времени
и: 'smoothed - сглаженный
о to'oscillate - колебаться
ou ei to overlay — наложить
e sentence.
|

| OSCILLATORS (continued)
Relative Strength Index (RSI)
The formula for the RSI is:
RSI = 100— 100/[(Up Average/Down Average) + I].
Where:
Up Average = The average of closes in a given amount of
time that are higher than the previous close.
Down = The average of closes in a given amount of time
that are lower than the previous close.
The RSI is a momentum indicator based upon price
movement over a specified period of time created by Welles Wilder. Some of the Droblems that are apparent in other momentum oscillators are eliminated in the RSI. Namely, by taking the up average and down average instead of the difference of prices, a smoother oscillator is created. For example, in a 14-day RSI the up average of the last 14 days is derived, as is the down average of the last 14 days. A constant band is created as well (from 0 to 100) which facilitates analysis of different securities.
The RSI is used as any momentum oscillator. Directional
movement, peaks, troughs. Divergence and crossing between short term and long term RSI's are looked for in the chart.
Overbought/oversold signals are given by crossing the 70 and 30 lines according to Welles Wilder. Instead of focusing only on the crossing of the overbought/oversold line, peaks and troughs of the oscillator should be examined for signals, with peaks expected to be at higher levels in a bull market than in a bear market, troughs occurring at lower levels in a bear market than a bull market. A peak in the RSI would suggest a price turn around to lower levels could be ahead, while a trough in the RSI suggests the opposite. Longer term RSI's will have less vitality than shorter term RSI's, if many overbought/oversold signals are desired, use of a shorter term RSI would generate them, but these will not have the same weight as the less sensitive RSI in terms of medium to long term trends.
| Vocabulary
|
| e
|
| momentum - скорость движения
|
|
|
|
|
|
|
|
|
|
|
| i
|
| to eliminate — уничтожать, снимать
|
|
|
|
|
|
|
|
|
|
|
|
|
| u:
|
| smooth — гладкий, ровный
|
|
|
|
|
|
|
|
|
|
|
|
|
|
|
| ai
|
| to derive - получать
|
|
|
|
|
|
|
|
|
|
|
|
|
|
|
| э:
|
| raw — грубый
|
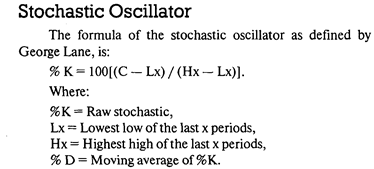
The stochastic recognizes that in an uptrending market the close tends to be near high, while in a downtrending market, the
close is near the lows of the time period. Using the above formula, a "raw" stochastic is found.
A three—day moving average of the "raw" stochastic is used by MMS, as the "raw" stochastic is very volatile, giving false signals. The three—day moving average is called the %K stochastic. A three—day moving average of the %K stochastic is called the %D, which gives a smoother momentum oscillator. This indicator will range between 100 (when the close is equal to the highest high of the last "x" periods) and 0 (when the close is equal to the lowest low of the last "x" periods).
The stochastic is used as any momentum oscillator, with directional movement, peaks, troughs, divergence, crossing between short term and long term stochastics, and crossing between %K and %D stochastics looked for in the chart.
Bollinger Bands—BB
Bollinger Bands are lines charted above and below the moving average of the closing prices. This analysis varies from other percentage band analysis because the distance of each band from the moving average is not fixed. Instead, the price channel these bands form around the moving average is flexible and determined by the user specifying a number of standard deviations.
The standard deviation is the method used to set the band width about the moving average. Bollinger used a 2% standard deviation to capture 95% of prices within the band. However a 1.5 standard deviation is commonly used for futures.
Bollinger Bands automatically narrow and widen in response to volatility — narrow in calm markets, and widen in volatile markets, making them an effective trend indicator.
Bollinger Bands are used with a simple price graph:
Prices near the lower band may signal an overbought market.
Prices near the upper band may signal an oversold market.
The bands often narrow before a sharp move in price. A narrowing of the bands indicates the start of a new trend, which is confirmed when prices break and close out of the band.
A price that breaks above the top band, followed by another that closes within, may signal a reversal and a good time to sell.
A price that breaks below the bottom band, followed by another that closes within, may signal a
Картограммы и картодиаграммы Картограммы и картодиаграммы применяются для изображения географической характеристики изучаемых явлений...
|
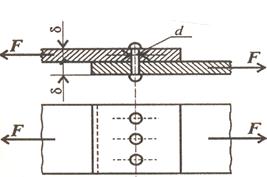
Практические расчеты на срез и смятие При изучении темы обратите внимание на основные расчетные предпосылки и условности расчета...
|
Функция спроса населения на данный товар Функция спроса населения на данный товар: Qd=7-Р. Функция предложения: Qs= -5+2Р,где...
|
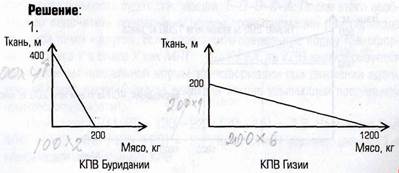
Аальтернативная стоимость. Кривая производственных возможностей В экономике Буридании есть 100 ед. труда с производительностью 4 м ткани или 2 кг мяса...
|
|
Признаки классификации безопасности Можно выделить следующие признаки классификации безопасности.
1. По признаку масштабности принято различать следующие относительно самостоятельные геополитические уровни и виды безопасности.
1.1. Международная безопасность (глобальная и...
Прием и регистрация больных Пути госпитализации больных в стационар могут быть различны. В центральное приемное отделение больные могут быть доставлены:
1) машиной скорой медицинской помощи в случае возникновения острого или обострения хронического заболевания...
ПУНКЦИЯ И КАТЕТЕРИЗАЦИЯ ПОДКЛЮЧИЧНОЙ ВЕНЫ
Пункцию и катетеризацию подключичной вены обычно производит хирург или анестезиолог, иногда — специально обученный терапевт...
|
|
Мотивационная сфера личности, ее структура. Потребности и мотивы. Потребности и мотивы, их роль в организации деятельности...
Классификация ИС по признаку структурированности задач Так как основное назначение ИС – автоматизировать информационные процессы для решения определенных задач, то одна из основных классификаций – это классификация ИС по степени структурированности задач...
Внешняя политика России 1894- 1917 гг. Внешнюю политику Николая II и первый период его царствования определяли, по меньшей мере три важных фактора...
|
