Студопедия Главная Случайная страница Обратная связь

Разделы: Автомобили Астрономия Биология География Дом и сад Другие языки Другое Информатика История Культура Литература Логика Математика Медицина Металлургия Механика Образование Охрана труда Педагогика Политика Право Психология Религия Риторика Социология Спорт Строительство Технология Туризм Физика Философия Финансы Химия Черчение Экология Экономика Электроника

Profit-Maximization in the Long-run


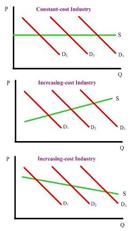
Assumptions:

Entry and exit only: The only long-run adjustment is the entry or exit of firms. Short-run adjustments are ignored in order to concentrate on the effects of the long-run adjustments. Identical costs. All firms in the industry have identical cost curves. This assumption lets us discuss and "average" or "representative," firm, knowing that all other firms in the industry are similarly affected by any long-run adjustments that occur. Constant-cost industry. The industry is a constant-cost industry. This means that the entry and exit of firms does not affect resource prices or, consequently, the locations of the average-total-cost curves of individual firms.

Long-run Supply for a constant cost industry:

industry expansion or contraction will not affect resource prices and therefore production costs. Any long-run supply curve for a constant cost industry is a horizontal line due to the fact that the entry and exit in a purely competitive market does not affect the price of a product. Long run supply curve is perfectly elastic. The demand curve for any industry is a downward sloping curve that intersects the supply curve at any point. All equilibrium prices will then be the same for all industries and firms.

LR supply for an increasing cost industry:

This is the case for most industries. When a new firm enters the industry, the resource prices increase so the long run cost curve increases as well. The entire ATC curve shifts upwards. Result: higher equilibrium price than the original price, which is why the increasing-cost industry graph at the right (second graph) is an upward sloping line. Industry produces as larger output at a higher product price because the industry expansion has increased resource prices and the minimum ATC. Thus, a higher price is required to induce more production, because costs per unit of output increase as production rises.

LR supply for a decreasing-cost industry:

Firms experiences lower costs as the industry expands, indicated by the third graph of the figure at the right (the title of that graph should be DECREASING-cost industry rather than "increasing").An example is the personal computer industry, in which the supply of personal computers increases by more than demand, causing the price of personal computers to decline. This decline in price is because the component producers (the makers of RAM, or the CPU, etc) can achieve economies of scale.

decreasing-cost industry


Дата добавления: 2015-09-04; просмотров: 531. Нарушение авторских прав; Мы поможем в написании вашей работы!


Расчетные и графические задания Равновесный объем - это объем, определяемый равенством спроса и предложения...


Кардиналистский и ординалистский подходы Кардиналистский (количественный подход) к анализу полезности основан на представлении о возможности измерения различных благ в условных единицах полезности...


Обзор компонентов Multisim Компоненты – это основа любой схемы, это все элементы, из которых она состоит. Multisim оперирует с двумя категориями...


Композиция из абстрактных геометрических фигур Данная композиция состоит из линий, штриховки, абстрактных геометрических форм...

Особенности массовой коммуникации Развитие средств связи и информации привело к возникновению явления массовой коммуникации...

Тема: Изучение приспособленности организмов к среде обитания Цель:выяснить механизм образования приспособлений к среде обитания и их относительный характер, сделать вывод о том, что приспособленность – результат действия естественного отбора...

Тема: Изучение фенотипов местных сортов растений Цель: расширить знания о задачах современной селекции. Оборудование:пакетики семян различных сортов томатов...

Хронометражно-табличная методика определения суточного расхода энергии студента Цель: познакомиться с хронометражно-табличным методом опреде­ления суточного расхода энергии...

ОЧАГОВЫЕ ТЕНИ В ЛЕГКОМ Очаговыми легочными инфильтратами проявляют себя различные по этиологии заболевания, в основе которых лежит бронхо-нодулярный процесс, который при рентгенологическом исследовании дает очагового характера тень, размерами не более 1 см в диаметре...

Примеры решения типовых задач. Пример 1.Степень диссоциации уксусной кислоты в 0,1 М растворе равна 1,32∙10-2   Пример 1.Степень диссоциации уксусной кислоты в 0,1 М растворе равна 1,32∙10-2. Найдите константу диссоциации кислоты и значение рК. Решение. Подставим данные задачи в уравнение закона разбавления К = a2См/(1 –a) =...

Studopedia.info - Студопедия - 2014-2026 год . (0.012 сек.) русская версия | украинская версия