The limit stress diagram and the cycle amplitude
To determine the fatigue strength under the stress action with asymmetrical cycles a different type of diagrams is drawn. The most different ones from them are: 1) the limit cycle stress diagram in the coordinates 2) the limit cycle amplitude diagram in the coordinates Consider these diagrams. In the first type diagram the limit cycle stress corresponding to the fatigue strength is put on the vertical line, the average stress is put on the horizontal axis (Fig. 11.6). At first the point C is drawn on the axis Draw the point P on the diagram the ordinate of which represents itself the fatigue strength for the pulsating cycle For many materials the values Analogically the fatigue strength is determined by the experience way for the asymmetrical cycles with the other parameters.
Fig. 11.6.
Fig. 11.6 The results are drawn on the diagram in points A, B and so on the ordinates of which are the fatigue strength for the corresponding stress cycles. The point D laying simultaneously on the bisector OD characterizes the limit stress (the ultimate strength) for the constant load As for the plastic materials the yield point is the dangerous stress too, the horizontal line KL is drawn on the diagram the ordinate of which is equal to This diagram is usually simplified by displacing it by two straight lines CM and ML whereby the line CM is drawn through the point C (corresponding to the symmetrical cycle) and the point P (corresponding to the pulsating cycle). The pointed way of the diagram scheme of the limit stress was suggested by S. V. Serenson and R. C. Kinososhwily. In this case in the limit of the straight line CM the limit cycle stress (the fatigue strength) is given by the formula
Or
where
The coefficient To draw the limit cycle amplitude diagram the cycle stress amplitude is put on the vertical axis, the average cycle stress
Fig. 11.7.
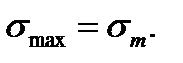
Point A of the diagram corresponds to the fatigue strength under the symmetrical cycle because for this cycle Point B corresponds to the ultimate strength under the constant stress because Point C corresponds to the fatigue strength under the pulsating cycle because
 and and
For plastic materials the stress limit should not overcome the yield stress
The final diagram of the limit stresses has the form AKD. In practice usually the approximate diagram The designs with the limit stress diagram and the limit cycle amplitude under the same approximate ways lead to the same results.
Tabl. 11.1
|


 the ordinate of which represents itself the fatigue strength under the symmetrical cycle
  (under the symmetrical cycle the average stress is equal to zero). Then the fatigue strength is determined experimentally for any asymmetrical load, for example for pulsating, which has the maximum stress always twice more than the middle one.
 and
and  are determined and represented in the reference book.
 (for the plastic materials not having the yield area, the role
  plays the condition yield point
  ). Hence the limit stress diagram has the form CAPKL finally.
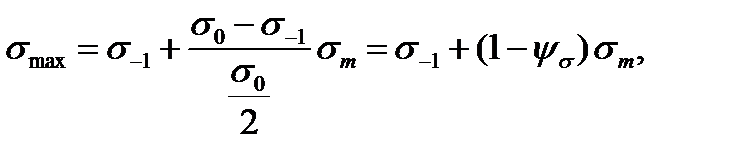 (11.6)
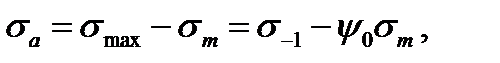 (11.7)
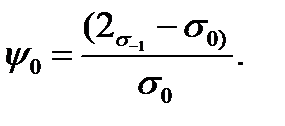 (11.8)
 is called the coefficient of the material sensitivity. The value
  and analogically the coefficient in torsion
  are given in table 11.1.
 = 0.
= 0.
 drawn by three points A, C, D and consisting of two the straight regions AL and LD (Serenson-Kinosishwily’s method) is used. Point L is received as the result of DE and AC lines crossing.
 MPa
MPa
 (bending, tension, compression)
 (torsion)