Студопедия Главная Случайная страница Обратная связь

Разделы: Автомобили Астрономия Биология География Дом и сад Другие языки Другое Информатика История Культура Литература Логика Математика Медицина Металлургия Механика Образование Охрана труда Педагогика Политика Право Психология Религия Риторика Социология Спорт Строительство Технология Туризм Физика Философия Финансы Химия Черчение Экология Экономика Электроника

Summarise the information by selecting and reporting the main features and make comparisons where relevant.


The chart below shows the amount of money per week spent on fast foods in Britain. The graph shows trends in consumption of fast foods. Write a report for a university lecturer describing the information shown below.

Summarise the information by selecting and reporting the main features and make comparisons where relevant.

Write at least 150 words.

The bar chart illustrates the expenditure on three different types of fast food such as hamburgers, fish and chips and pizza in people in different level of income.

From the chart, it is clear that in a high-income group, 40 pence is spent on hamburgers a week, which is the largest among the expenditures on all the three types of fast food. This expenditure is also the greatest one in the average income group, but the amount of money spent is only about 33 pence a week, much less than that in the high-income group. As for the low-income group, the largest expenditure is on fish and chips, about 18 pence a week.

The line graph compares the trends of the amount of three type of fast food consumed between 1970 and 1990. It is clear that the amount of hamburgers and fish and chips consumed showed an increasing trend, while pizza consumed gradually decreased from 300g in 1970 to 700g in 1985, before it grew to about 240g in 1990. The consumption of fish and chips overtook that of pizza and hamburgers in 1982 and 1988 respectively.

You should spend about 20 minutes on this task. The pie charts show the main reasons for migration to and from the UK in 2007. Summarize the information by selecting and reporting the main features and make comparisons where relevant. Write at least 150 words.


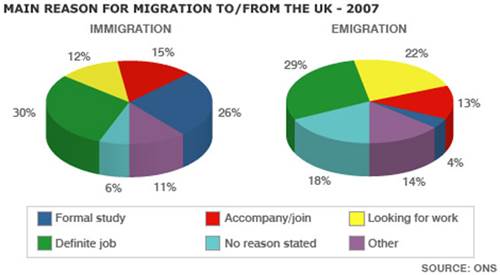
The pie charts illustrate the primary reasons that people came to and left the UK in 2007. At first glance it is clear that the main factor influencing this decision was employment.

Having a definite job accounted for 30 per cent of immigration to the UK, and this figure was very similar for emigration, at 29%. A large number of people, 22%, also emigrated because they were looking for a job, though the proportion of people entering the UK for this purpose was noticeably lower at less than a fifth.

Another major factor influencing a move to the UK was for formal study, with over a quarter of people immigrating for this reason. However, interestingly, only a small minority, 4%, left for this.

The proportions of those moving to join a family member were quite similar for immigration and emigration, at 15% and 13% respectively. Although a significant number of people (32%) gave ‘other’ reasons or did not give a reason why they emigrated, this accounted for only 17% with regards to immigration.


<== предыдущая лекция | следующая лекция ==>
Самостоятельная работа. 1. Создайте новую публикацию. Поместите в нее файлы различных форматов, установив флажок Show Import Options (Показать параметры импорта) в диалоге Place | 

Дата добавления: 2015-09-06; просмотров: 1613. Нарушение авторских прав; Мы поможем в написании вашей работы!


Расчетные и графические задания Равновесный объем - это объем, определяемый равенством спроса и предложения...


Кардиналистский и ординалистский подходы Кардиналистский (количественный подход) к анализу полезности основан на представлении о возможности измерения различных благ в условных единицах полезности...


Обзор компонентов Multisim Компоненты – это основа любой схемы, это все элементы, из которых она состоит. Multisim оперирует с двумя категориями...


Композиция из абстрактных геометрических фигур Данная композиция состоит из линий, штриховки, абстрактных геометрических форм...

Растягивание костей и хрящей. Данные способы применимы в случае закрытых зон роста. Врачи-хирурги выяснили...

ФАКТОРЫ, ВЛИЯЮЩИЕ НА ИЗНОС ДЕТАЛЕЙ, И МЕТОДЫ СНИЖЕНИИ СКОРОСТИ ИЗНАШИВАНИЯ Кроме названных причин разрушений и износов, знание которых можно использовать в системе технического обслуживания и ремонта машин для повышения их долговечности, немаловажное значение имеют знания о причинах разрушения деталей в результате старения...

Различие эмпиризма и рационализма Родоначальником эмпиризма стал английский философ Ф. Бэкон. Основной тезис эмпиризма гласит: в разуме нет ничего такого...

Потенциометрия. Потенциометрическое определение рН растворов Потенциометрия - это электрохимический метод иссле­дования и анализа веществ, основанный на зависимости равновесного электродного потенциала Е от активности (концентрации) определяемого вещества в исследуемом рас­творе...

Гальванического элемента При контакте двух любых фаз на границе их раздела возникает двойной электрический слой (ДЭС), состоящий из равных по величине, но противоположных по знаку электрических зарядов...

Сущность, виды и функции маркетинга персонала Перснал-маркетинг является новым понятием. В мировой практике маркетинга и управления персоналом он выделился в отдельное направление лишь в начале 90-х гг.XX века...

Studopedia.info - Студопедия - 2014-2026 год . (0.014 сек.) русская версия | украинская версия