Experimental part. · Collect also circuit on the Fig
· Collect also circuit on the Fig. 1.2
· Remove the waveforms or virtual instruments measure the amplitude values of voltage Vm and current Im for enter it in the appropriate table cell in Table 2.1.
· Transfer the value of Xc to the chart (fig 2.1) for a curve
Table 2.1
| f, кHz
|
| 0,8
| 0,6
| 0,4
| | Vm,V
| 1,0 uF
| 4.8
| 4.8
| 4.8
| 4.8
| | Vm,V
| 0,47 uF
| 4.8
| 4.8
| 4.8
| 4.8
| | Vm,V
| 0,22 uF
| 4.8
| 4.8
| 4.8
| 4.8
|  , mА , mА
| 1,0 uF
| 27.1
| 21.6
| 16.2
| 11.0
|  , mА , mА
| 0,47 uF
| 14.6
| 11.7
| 8.9
| 6.0
| | , mА
| 0,22 uF
| 6.5
| 5.2
| 3.9
| 2.6
|  =Vm/Im, Ohm =Vm/Im, Ohm
| 1,0 uF
| -178.1
| -223.6
| -298.4
| -438.7
|
0,47 uF
| -329.6
| -410.9
| -543.4
| -806.6
|
0,22 uF
| -740.4
| -915.2
| -1234,1
| -1810.1
| Хс = 1/( С), Ohm С), Ohm
| 1,0 uF
| -160
| -200
| -260
| -400
|
0,47 uF
| -340
| -420
| -600
| -900
|
0,22 uF
| -720
| -900
| -1100
| -1800
|
Fig 2.1
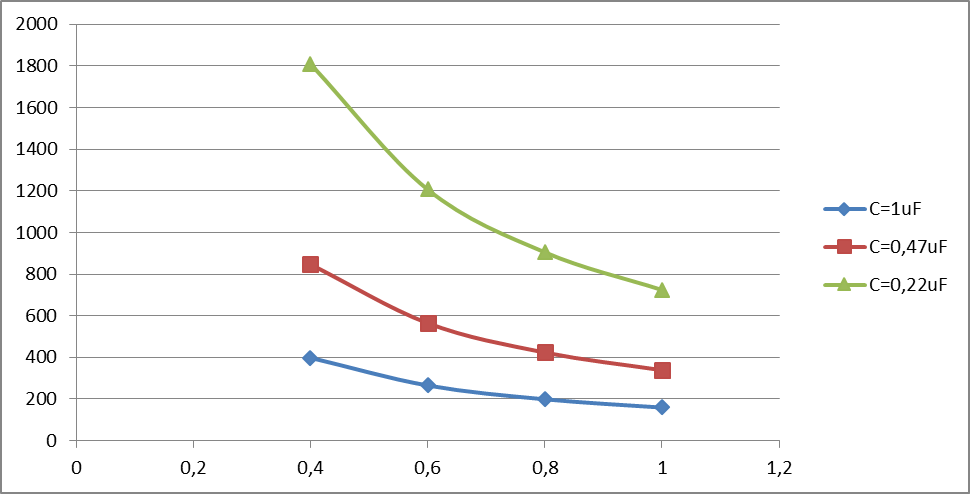
Xc-frequency

Важнейшие способы обработки и анализа рядов динамики Не во всех случаях эмпирические данные рядов динамики позволяют определить тенденцию изменения явления во времени...
|
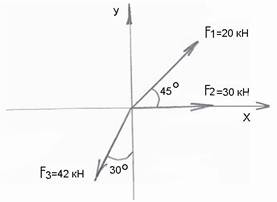
ТЕОРЕТИЧЕСКАЯ МЕХАНИКА Статика является частью теоретической механики, изучающей условия, при которых тело находится под действием заданной системы сил...
|
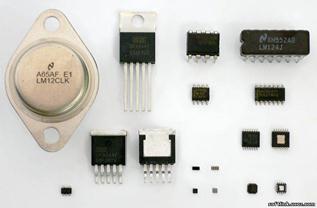
Теория усилителей. Схема Основная масса современных аналоговых и аналого-цифровых электронных устройств выполняется на специализированных микросхемах...
|
Логические цифровые микросхемы Более сложные элементы цифровой схемотехники (триггеры, мультиплексоры, декодеры и т.д.) не имеют...
|
Понятие метода в психологии. Классификация методов психологии и их характеристика Метод – это путь, способ познания, посредством которого познается предмет науки (С...
ЛЕКАРСТВЕННЫЕ ФОРМЫ ДЛЯ ИНЪЕКЦИЙ К лекарственным формам для инъекций относятся водные, спиртовые и масляные растворы, суспензии, эмульсии, новогаленовые препараты, жидкие органопрепараты и жидкие экстракты, а также порошки и таблетки для имплантации...
Тема 5. Организационная структура управления гостиницей 1. Виды организационно – управленческих структур. 2. Организационно – управленческая структура современного ТГК...
|
Условия приобретения статуса индивидуального предпринимателя. В соответствии с п. 1 ст. 23 ГК РФ гражданин вправе заниматься предпринимательской деятельностью без образования юридического лица с момента государственной регистрации в качестве индивидуального предпринимателя. Каковы же условия такой регистрации и...
Седалищно-прямокишечная ямка Седалищно-прямокишечная (анальная) ямка, fossa ischiorectalis (ischioanalis) – это парное углубление в области промежности, находящееся по бокам от конечного отдела прямой кишки и седалищных бугров, заполненное жировой клетчаткой, сосудами, нервами и...
Основные структурные физиотерапевтические подразделения Физиотерапевтическое подразделение является одним из структурных подразделений лечебно-профилактического учреждения, которое предназначено для оказания физиотерапевтической помощи...
|
|
