Measuring of info signal frequency using digital method
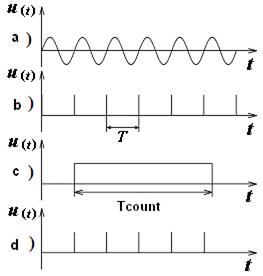
Currently, the digital method was the most common. On the basis of much of the built of frequency produced by industry. Typically, a digital frequency meter provides the ability to measure not only the frequency but also the period of repetition and time intervals. Some devices can measure and other parameters of signals and circuits, pre-converting them into a time interval or frequency. Thus, digital frequency meters are a good basis to build multipurpose devices. In particular, digital electronic frequency counters (DEFC), we can measure the frequency, the period of the signal, the ratio, difference, sum frequency, etc. The study is based on the principle of frequency digital discrete calculation: counting the number of pulses over a certain period of time, which has many advantages. These include a wide measuring range, high accuracy and robustness, the possibility of releasing the results of measurements on printing, etc. Frequency measurement is carried out by direct comparison of the frequency f s res of the signal with the value of the standard frequency f s ast created by a quartz oscillator, as a measure. The most optimal in terms of reducing the error measurement result, this mode will be provided if the measured frequency is much higher than the frequency of the signal model. In this mode, a periodic signal of frequency f s res is applied to a frequency input (Fig. 1). After the input device (1) study the signal goes through the switch (2) (key switch is in position 1) to the transmitter analog signal to digital (3). Here, the analyzed signal (for example sine wave) is transformed into a periodic sequence of short pulses (Fig. 2). The individual pulses of this sequence can be generated in moments of transition sinusoidal signal with a zero derivative of the same sign. Thus, the frequency of these pulses coincides with the frequency f s res of the measured signal. Furthermore, this sequence of pulses is fed to one input of a temporary selector (4). At the time the other input selector is applied, the so-called strobe pulse. Formation of strobe pulse occurs in the control channel, a model in which the voltage frequency generated by the crystal oscillator is fed through the switch (8) (key switch is in position 1) through a block of frequency division (9) sharper (10).
In Fig. 2 shows the stress distribution of DEFC that demonstrate the essence of the digital method, which is reduced to counting the number of pulses N, arriving at the counting unit (11) for a time equal to Т acc, titled "TIME MEASUREMENT" or "COUNTING TIME", i.e.
Where f sact – the actual value of the measured frequency. Thus, the frequency of the signal is determined by the expression:
where Т count = Т qg. Measuring the counting unit will go to the (N ± 1) due to the sampling pulse, then
where Т count = nТ qg; Т qg – the period of oscillation oscillator; n – frequency division ratio of the block (9).
Measuring the frequency with electronic frequency counter there are two error components: measures (due to instability of the frequency oscillator) and comparison (by sampling). In today's digital frequency crystal oscillators are used with relative frequency instability of the order of ± 10-10... 10-12. Accuracy is determined by comparing mainly discreteness error, that is due to the fact that the front and drop the control (strobe) pulse is not synchronized with the appearance of a periodic sequence of pulses, formed from the test signal, or, in other words, this error is associated with a multiple of the periods of measuring signal model. The maximum value of the absolute error of discreteness Δ N:
It does not depend on the frequency of the signal and is expressed in Hz. Reduce the value of the absolute error can be due to the increase of measurement time T acc. The minimum value of Δ N can be obtained at T calc due to the limits on the counting unit electro-counting frequency meters, that is
where q – the number of electronic frequency counter rank. Then, using (4)
The maximum value of the relative discrete error is given by
where N – the number of pulses received by the counting unit of electronic frequency counter. The total error in measuring the frequency
where δqg – component of the error, introduced by the measure (crystal oscillator).. Position the decimal point is determined by measuring the degree of a series of numbers expressing the measurement time Т count in milliseconds, which implies a measurement of frequency, "kHz", as specified in the display frequency. This series of numbers is as follows: Т count = (100; 101; 102; 103; 104) ms. After calculating the Т calc is selected from the specified number of Т count, adhering to the following conditions: - if Т calc ≥ 104 ms, then we can take Т count = 104ms; - if 104ms> Т calc > 103ms, then choose Т count = 103 ms and so on. The result is displayed electronic frequency counter, as mentioned is in kHz.. Example. Frequency of the signal is 650 kHz. The measurement is carried out by electronic frequency counter of Ч3-57 type. Its main metrological characteristics (МC): - a range of measuring frequency of 0,1 GHz ÷ 100 МHz; - period measurement range 1mcs ÷ 104ms; - counting time 100 ÷ 104 ms; - period factor 100 ÷ 104; - time markings 0,1 µs; 1 µs; 0,01 ms; 0,1 ms; 1 ms; - digits number – 7. You must define: Т count, Δ N and δ N and record the measurement result. Solution. We define:
Based on the above recommendations, select Т count = 104 ms = 10 s. Absolute accuracy:
Discrete ratio error:
Where f с – in Hz; Т count– per second. The result on the display is 650,0000 kHz.
Measuring low-frequency error of discreteness is the defining component of measurement error. For example, if the measured frequency f s res = 5 Hz at Т count = 1 s, maximum value of absolute discrete error Δ N = ± 1 Hz, and the maximum value of ratio error Thus, because of the large discrete low-frequency error is directly measured by a digital frequency meter with a low accuracy. Therefore, finding ways to reduce the influence of the discreteness error in the measurement result has always been one of the important directions of development of digital frequency-measurement technology. The first way is obvious: it is to increase the duration of the "gate time", that is the duration of the measurement time. But the possibilities of this method is limited because conventional digital frequency counter (non-microprocessor), the maximum possible duration of the measurement time Т count = 10 s. The second way is to increase the number of pulses that fill "time-gate", which is achieved by multiplying the frequency of the signal. The maximum absolute error does not change (if not change the duration of "time-gate"), but decreases the relative error (in the number of times of multiplication). The implementation of this method involves the use of additional power - frequency multiplier, which makes it difficult and expensive equipment. The third method, which takes into account the random nature of the error of discreteness, implies a multiple of observations (individual measurements) and averaging the results. This is an effective way to reduce the influence of random error in the measurement result. The fourth method is direct measurement of the period of the signal and then calculating the numerical values of the frequency (f s = 1/ Т сount), the inverse result of the measurement period. This path can dramatically reduce the error in the measurement of discrete low frequencies.
|

 ,
,


 .
.
 ,
,
 ,
,
 ,
,
 .
.
 Hz.
Hz.
 .
.
 , that is 20%, which is unacceptably high.