Theory & Experimental methods
Apparatus: · 150 to 200 mm long pieces of 16 or 18 gauge wire of copper and GI wire · Ring stand · Adjustable single-burette clamp · Meter rule · Small paper cup (a 25g paper cup works well) · Variable masses (lead shot or small ring-washers) Experimental set-up:
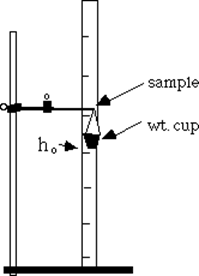
Figure 1: Diagram of set-up Figure 1, gives visual information how equipment has carried out. First of all, wire was connected and fixed in the clamp, after that was measured and recorded initial height of the wire. Then was attached small paper cup to the end of the wire. Thereafter by adding masses, putting inside the cup, was measured and recorded changed height. Each time the mass increased. When the mass has reached the critical point, at which deformation changed from elastic to plastic, was recorded changed height.
Measurements Table 1. Raw data for the 18 gauge of Copper wire
Diameter = 1.34 mm. Reference height Table 2. Raw data for the 16 gauge of Copper wire
Diameter = 1.083 mm. Reference height
Table 3. Raw data for the GI wire
Diameter = 1.34 mm. Reference height Uncertainties: Mass = ±0.1 g Height = ±0.1 cm Displacement can be determined as the difference between reference and changed heights.
Where
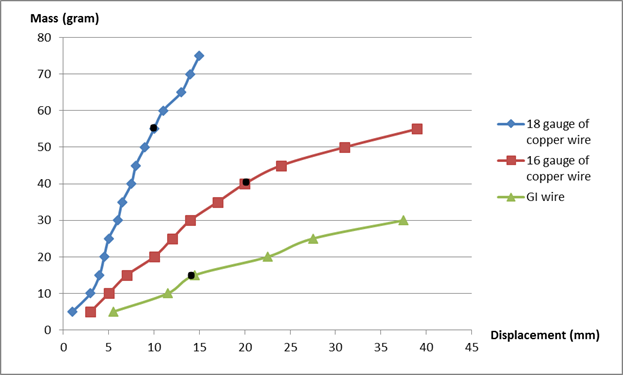
Results and Discussions The graph below is the graph of force versus displacement for each of the different types of wire. Graph 1. Force vs Displacement for each type of wire.
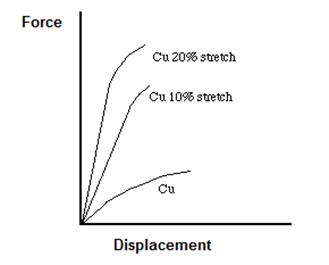
Graph 1 was plot by using the data from the tables about each type of wire. Graph above, gives visual information about the deformation, can be clearly seen the point where deformation changes from elastic to plastic deformation. The point where deformation is changes, called Yield point. According to Encyclopedia Britannica “The yield point, alternatively called the elastic limit, marks the end of elastic behaviour and the beginning of plastic behaviour.”. Drawing on the tables data and visual information from graph, Yields point can be found. Yield strength for each type of wire (on the Graph 1, shows as the black dots). 18 gauge Cu wire = 55g 16 gauge Cu wire = 40 g Uncertainties: ±2-3g GI wire = 15g Yield strength. Figure 2. Force vs Displacement for wire samples
Figure 2, shows the sample graph, which could be made. Comparing made and reference graph, can be clearly seen that there is the some difference between them. Especially for 18 gauge of Cu wire.
|
 mm. Distance = 84 mm.
 is the initial (reference) height, and
  is the changed height.