Creating reports using (Design View)
Exercise: Use (Design) to create a report that depends on (Employee Table). Steps: 1- Select (Reports) and click (New) as before. 2 From (New Report), select (Design View) and click Ok, so the report appears in (Design View) as in the following figure:
Notice the appearance of (field list) of [an employee table]. Highlight the first field and click shift and select the last field from the list so as to select all fields. Insert the fields to [Detail Section] as in the following figure.
· From (View) select [Print Preview] to display the report as in the following figure:
The Report appears in [Print Preview]as in the following figure:
Make improvements in text boxes and their titles in (Design View) so the final figure appears in (Print Preview] as follows:
Ways of Reports display: You noticed as before that, we can use two ways to display the report and to navigate between them you can select (View) as follows:
The following figure shows the different ways for the (Report View), this is
· Report Sections: Report sections look like working with (Form Sections). The report is distinguished from the form because of the existence of their own sections. By using the report sections, you can arrange data as categories'. For example, you can display projects names and the employees working in them. You can also calculate the number of the working hours in the project for each employee and the total of the working hours in all the projects. - So far, we deduce that the report includes the following sections: 1. Page Header and Footer 2. Report Header and Footer 3. Custom Section Exercise: To display (Page Header) and (Footer) and (Report Header) and (Footer) do the following steps: From (View Menu) activate icons of (Page Header and Footer) and (Report Header and Footer) as in the following figure:
Exercise to display the section customized for the report.
· In (Design View) from the toolbar "Report Design" click the symbol. (Sorting and groups) So the following figure appears:
· Select (Field Expression) to sort data then select either (Ascending or Descending). So the following figure appears.
· Select "Yes" in front of both (Header and Footer) of (Custom Group) so the report appears as in the following figure:
Notice that in (Custom Group), data will be arranged in the field of (Employee Name) in an (ascending) way. Exercise: Use (Custom Section) for the report to display the employee's name and his projects. Steps: · Create a query that links the tables of (Employee) and (Employee- Project) as in the following figure:
· Save the Query as (Employee _Project). · Create a report whose source recordes is the query (Employee Project) as in the following figure
· Insert the field queries for the section of the report (Details). · Create a customized section for the (Employee Name) in an ascending way including (Header and Footer) for the group. · Drag the name of the (employee name)for the section of
In the previous figure, we noticed the following: 1. Data are arranged according to the field (Employee – Name) in an ascending way. 2. The employee and the projects are displayed in each group. Data values can be collected in the report, to express totals. You can do this by inserting unbound textboxes to the report and inserting the suitable formulas. We should consider the following: On inserting the textbox at the footer of the custom group section with a certain formulae, totalizing for this group can take place. On the other hand, on inserting the textbox at footer of the report section with the same formulae, we can calculate all groups. We notice the importance of (the Textbox) place (with a formula) inside the report sections. Exercises: In this exercise, we will try to calculate the working hours for each employee and count the working hours for all projects. Steps: We come back to "Report Design" in the previous exercise and we will try to put the (text box) once at (page footer) of the employee section and another at the (report footer) as in the following figure:
Modify the text box title in the two sections and write (total).
· From data and in front of (Control Source) click the button to get (Expression Builder) · With the help of (Expression Builder). Try to edit the expression as in the following figure:
· Click OK. · Similarly, select the second box and edit the same formula. - Click OK. - Display the report in (Print Preview) so the following figure appears:
· Inserting common expressions: Many common expressions can be inserted in the report sections, out of these are (The total page number and date) Exercise: To insert Date and Time in report sections do the following steps: - Display the previous report in "Design View" * From (View) select (Page Header and Footer) and (Report Header and Footer) 1- from the menu (insert), select (Date and Time): 2- Select the suitable format and click Ok. As in the following figure:
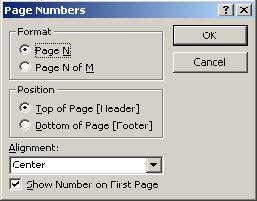
3-Similarly, from menu [ insert ] select page number as in the following figure : 4-Select the suitable format and click ok.
The report appears as follows:
Exercise: With the help of your teacher, try to insert (Time and Date) using one of the unbound elements.
Questions: 1. What are the types of reports provided by Ms Access? How is each type used?
2. What is the difference between data retrieved by reports and the stored elements in the reports design view?
3. What are the methods of creating reports and what is the difference between then?
4. Mention the importance of dealing with reports sections?
5. Shifting between the ways of (Report View) has its importance at the stage of (Design), illustrate for your answer?
6. Can we navigate across folders on (Report Preview)?
7. What is the importance of dealing with the calculated and counted values in reports?
8. What are the common expressions and how can we insert them in reports?
Exercises: 1. Create a report whose record source are the table of (Employee- Projects) using (Design View) and display this report in (print Preview). 2. Insert a mathematical expression, to find the employee salary in every project he works in and modify in the table if there is a need for modification, to find the total cost for the projects in terms of the employee salary. 3. Insert common expressions in the previous report using the [Unbound] elements style.
|
 Steps: