Installation. An installation for testing elastic buckling of a pin-ended bar is shown in Fig.4
An installation for testing elastic buckling of a pin-ended bar is shown in Fig.4. Bar 1 loading is realized by the lever 6 allowing to decrease load values. Lever 6 runs through the slot in the frame upright and rests on the prism providing a pin joint. The weight of the long lever 6 with the load bracket 7 is balanced by the counterweight 5. The lower bar end 1 is rested on sole 2, the upper end is fixed in slider 3, which is freely sliding, relative to frame 4 along the director, vertically. The pin-ended bar is ensured by this construction.
The installation functions in the following way.
Fig.4.
The loads installed on bracket 7 by lever 6 compress the bar 1. Indicator 9 will show the value of the deflection
where
a, b are the lever arms (Fig.4).
Testing specimen
Testing bar 1 with a rectangular cross-section is shown in Fig.5. The bar ends are sharpened to ensure a free turn of the butt-end section.
Fig.5. Testing specimen Order
Make the following operations to determine the critical force using Southwell’s method: 1. Measure the 2. Set up the bar in the installation. 3. Balance the system by couterweight 5 so that lever 6 was in a horizontal position. 4. Measure the lever arms a and b, then put them in table 1. 5. Measure the weight G2 of bracket 7, lever 6, counterweight 5 and slider 3, write these down in table 1 (for the given installation G2 is equal to 48 N)
Table 1
5. Set the indicator hand to " O". 6. Place the weight G1=10H on bracket 7, take the indicator f1 readings and write down these in table 2 for each level. 7. Carry out the stepped loading in 1 N (100gr), take the reading of the indicator f1 to fix in table 2 for each level.
Table 2
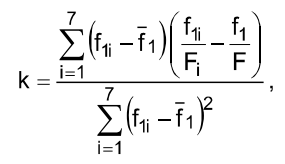
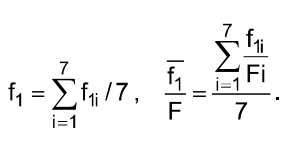
9. By the results of the experiment carry out the following: 9.1. Fill in table 2 using the formula (13) and table 1. 9.2. Calculate the value 9.3. Draw a plot (see Fig.3) with table 2 data. Draw a straight line so, that as many experimental points as possible, be near it. 9.4. Determine the critical force 9.5. Determine the critical force using the method of least squares, [3]. Let us write the equation (8) in conformity with (9), (10), (11)
or
That is the straight line equation (see Fig.3). From the experiment (Table 2) we have some equations
where i =1, 2...7 corresponds to each load case G1. The values k and OB are occasional and they will be the most probable (the straight line will be the best), if the sum of the difference squares is minimum
or from the condition
we determine k and OB. After transforming we get
where
The critical force is
Carry out the calculation and put it in table 3. 9.6. Determine the percent divergence in formula (14) and put in table 3
Table 3
Report
The report must include: 1. The title page. 2. The goal of the work. 3. The description of the installation. 4. The test results. 5. Test questions answered.
|


 under any load due to the initial deflection and a centrical force action. The value of the compressive force is determined by the lever rule:
 is the load weight installed on bracket 7;
 is the bracket weight 7, lever 6, counterweight 5 and slider 3;
 length and the dimensions of the bar section h and c. Make three measurements and write down the average values in table № 1.

 using table 1 and the formula (2) with E=210 G Pa and
  =2, then put them in table 3.
 using the formula (12) and put it in table 3.


