Figure 10.
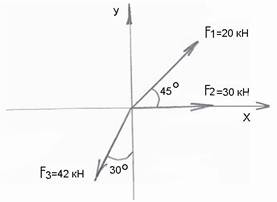
After set up equipment, were drawn Free Body Diagram of the system, including forces that action on the bar.
Figure 11 representing the forces acting on the irregular shaped bar. Where is Part C2 (Raw data and calculating) Raw data which were get from Experiment 2.1 and Experiment 2.2, has been recorded to the Table 5 and Table 6.
|


 Figure 11.
 is the distance between string and the beginning of the bar,
  is the gravitational force of the bar,
  gravitational force of the first known mass (10g),
  is the distance between the string and the first mass,
  is the distance between the string and the second mass and
  is the distance between the COM and the beginning of the bar.