Methods of processing the results of direct measurements containing random errors.
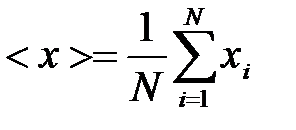
Let at the same conditions done N measurements and xi - the result of i-th dimension. The most probable value of the measured values - its arithmetic mean value:
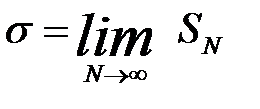
The value of <x> tends to the true value x0 of the measured value at N®¥;. Mean square error of a single measurement result is the quantity
When N®¥ SN tends to the constant limit s:
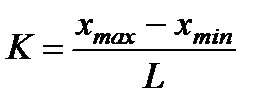
The quantity s2 called the dispersion of measurements. Lets divide whole set of measurements at intervals. From all N measurements lets choose the minimum and maximum values xmin and xmax. The number of intervals K will be equal to the quotient of the division
where L - step of interval.
1 – interval 2 – interval 3 – interval k – interval If on the abscissa the number of intervals will put aside, and on the ordinate- the number of measurements, whose results fall within this interval ni, we get the empirical distribution graph of the measurements by intervals called histograms.
With a large number of measurements the ratio ni / N characterizes the probability of occurrence of values of the measured values in this interval with step L. If ni/N divided by the step interval L, then the value will reflect the relative number of favorable cases to the unit interval. Diagram constructed for yi, shows the distribution of the probability density at intervals and is called the reduced histogram.. Now imagine that the measures continue so long as the number of measured values becomes very large. Step interval L can be made very small (provided that the instrument has sufficient sensitivity), and yet in each interval will be many measurements. In this case yi can be viewed as a continuous function of x. Now, if instead of histogram plot the dependence y = f (x), which gives the fraction measurements of ni, fall into the unit interval under a continuous variation of x, we obtain a smooth curve, called the distribution curve. The function y = f (x), respectively, called the density distribution. Its meaning is that the product f(x)dx (dx-differential of the independent variable) gives the fraction of the total number of measurements ni / N, falling on the interval from x to x + dx. In other words, f(x)dx is the probability that an individual randomly selected value of the measured value will be in the range from x to x + dx. The form of reduced histogram obtained for a small number of experiments can not be predicted in advance. But the theory of probability allows to calculate the shape of the limiting form of the smooth curve, which tends to histograms with an indefinitely large number of experiments. This curve is called a Gaussian curve.
where Gaussian function is normalized, i.e. f (x) satisfies the relation:
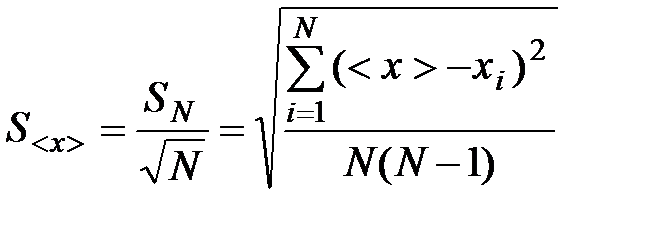
The integral has the infinite limits. This means that the measured value with probability 1 (or 100%) ranges from - ¥ to + ¥ or that the location of the measured value within these limits is an significant event. Probability density function has the following properties (see Fig. 2.): · Symmetric with respect to <x>, · reaches a maximum at <x>, · tends rapidly to zero as | xi - <x>| becomes large compared with s In practice it is often necessary to determine the arithmetic mean error. Analogically
The mean square error of the arithmetic mean is the mean-square error of a separate result, divided by the square root of the number of dimensions. This is the fundamental law of increasing accuracy with increasing number of observations. The probability that the true value lies within a certain range from <x>-Dx to <x>+Dx is called the confidence coefficient (coefficient of reliability, reliability) and the interval- a confidence interval. For sufficiently large values N confidence interval <x>±s<х>. Measure s approximation of the measured value x greatness to the true value x0 is defined by a physical entity measured value, as well as physical and structural principles of the measurement technique, so an infinite increase in the number of measurements does not give an appreciable increase in accuracy. Since there is no sense to strive for a very large number of measurements, then the experiment is carried out a limited number of procedures. However, for a given reliability a confidence interval, measured in fractions of s is undervalued. The question arises how the reliability depending on the number of dimensions? This dependence is complex and can not be expressed in terms of elementary functions. Factor determining the amount of space as a fraction of S<х> as a function of a and N, called the coefficients of the Student, denoted by ta,N, and exist from the tables of the Student's coefficient. Confidence interval D x can be calculated by the formula:
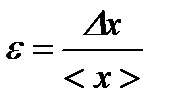
х = <x> ± Dx при a=К%. Obviously, when a=0,68 ta,N>1, but when N®¥ ta,N®1 Confidence interval of the experiment result generally corresponds to the confidence level a=0,95. If a=0,95 ta,N>2, but with N®¥ ta,N®2. To assess the accuracy of the experiment one calculates the relative error of the experiment. The relative error is the error expressed in fraction of the true value of the measured values:
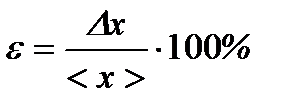
It is often expressed as a percentage:
|

 ,
, ,
, ,
, .
. ,
, - as already mentioned, is the dispersion,
  characterizes the distribute of measurements about arithmetical mean value and is called the standard deviation or mean square error.
 .
. .
. .
.  .
. .
.