1. What do trend lines indicate? Trend lines indicate trend direction
2. What does a trend line join?
To draw a trend line you must join two extremes that are consecutive (and of similar magnitude).
3. In what case is a trend line not valid?
A trend line must not cut across any other price data — else it is not a valid trend line. A trend line should not be drawn just anywhere.
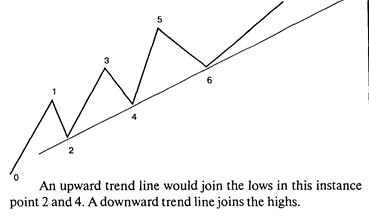
4. How is an upward trend line drawn?
Graphically, an upward trend line is drawn up toward the top right hand side of the Y-scale.
5. How can you idetify up trends?
There are two ways to identify up trends: look for higher highs and higher lows. Look for extreme pivot points. When joining points to produce a trend line in an upward trending market, you join the low points.
6. What does a climax followed by a retest signified? The end of a trend is usually signified by a climax (peak) followed by a retest of one of the extremes (either the high or the low) whilst it is in the ranging stage. Usually the test is of the low if the trend is moving towards a down trend and on the high if the trend is moving upward.
7. How many points does a down trend require?
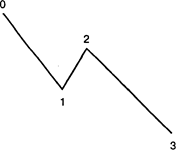
• A down trend requires a minimum of four points.
• It needs a lower low (from I to 3) and a lower high (from O to 2).
8. How is a market sideways trend drawn?
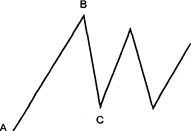
• A sideways market requires two extreme points — in this instance A and B.
• To confirm a sideways market there must be a retest of
one of these extreme points (in this instance the retest is
of the low point C).
9. How many highs does an up trend require?
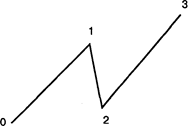
• An up trend requires a minimum of four points.
• It needs a higher low (from 0 to 2) and a higher high (from 1 to 3).
10. What trend indicators do you know?
Tools that can be used to indicate a trend include:
Trend lines, Moving Averages
11. What trend characteristics are identified by price patterns?
Patterns are used to identify the following characteristics about trends:
1. Trend Identification
2. Trend Reversals
3. Trend Continuation
Trend lines are used to determine what type of trend is in force. General theory is, once a trend line is penetrated, it is a signal for consolidating market — in other words it is time for a sideways movement and not an immediate buy or sell signal as often thought.
Ex. 3. Put questions to the underlined words.
Ex. 4. Read and translate the text.
TRANSLATION PRACTICE
THE SIGNIFICANCE OF TRENDLINE ANALYSIS
| The misused
Trendlines are one of the simplest and most useful indicators in Technical Analysis. They also happen to be one of the most misused.
"One of the biggest mistakes made by beginners and professionals alike, is inconsistently defining and drawing the trendline. To be useful, the trendline must accurately reflect the definition of the trend."
(Victor Sperandeo)
The Classic Trendline
Like manv other Technical Analyses, trendline analysis is considered an "art" rather than an exact science. This does not mean. however, that a trendline can be drawn "iust anvwhere". Certain conditions must be followed in order to enforce the usefulness of this tool. We will discuss some of the standards maintained by trendline users in the market place today and look at the means of determining where and how trendlines should be drawn. A trendline requires you to ioin three price extremes. This means you need to join three low points when the market is in an up-trend or three high points when it is in a down-trend. Joining less than three points — for instance, joining two, indicates a tentative trendline that mav become valid but still requires confirmation from future price action. When ioinine the three price extremes, the trendline must not cut across any other price data — otherwise it is not a valid trendline.
Trendline Signals
Having drawn the trendline. vou are then able to derive
three essential clues. If prices breach the trendline this indicates a change in the rate at which the market is changing direction. It also indicates that the market may not continue in the same direction it had in the past. However, it does not indicate an immediate change from an up-trend to a down-trend, as many tend to think. It points instead to a change from the existing up or down trend to a sideways trend or a congested market. If any part of the trendline is breached, that trendline should be redrawn or else considered invalid. (See Diagram 1) The steeper the trendline, the less likely it is that the trend will hold. Manv traders use the principle that the steepness of
| Vocabulary
i significance — значение
i.misused — используемый неправильно
inconsistant — непоследовательный, противоречивый
э: enforce — реализовать
i: extreme — крайняя точка
| |
| |
| е 'tentative - условный, требующий подтверждения
ai to derive — получать, извещать
и: 'clue - ключ (информация) к решению проблем
| |
| |
| the trendline should be 45 degress — but this is a subjective view derived primarily from the work of Gann. Trend channels are often drawn bv traders to identify areas that are overbought (up-trends) or oversold (down-trends).
| as 'magnitude
| — величина
|
| The Wyckoff Trendline
The principles and conditions that make up the "classical trendline" are in many respects a variation of Wyckoffs original findings on this subject. Wyckoff included the following conditions:
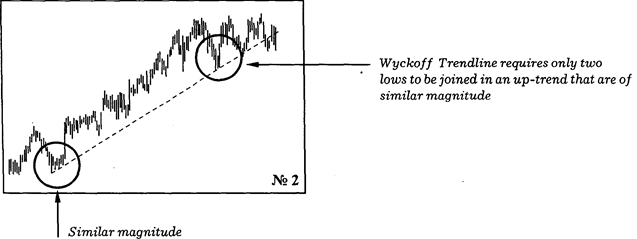
Firstly, he argued that a trendline requires you to join only two price extremes as opposed to three. He qualified this by specifying that the two price extremes had to be consecutive and of similar magnitude. {See Diagram 2) This condition of similar magnitude to validate a trendline is now disregarded by most traders using the Classic Trendline conditions. It is however, an important measure of the change in trend. For instance, if a Wyckoff trendline is breached, the concept of similar magnitude indicates the degree of the change in trend of that particular time frame.
| I 0:
to disregard — не принимать во внимание
|
| л to recover
| - восстанавливать
| |
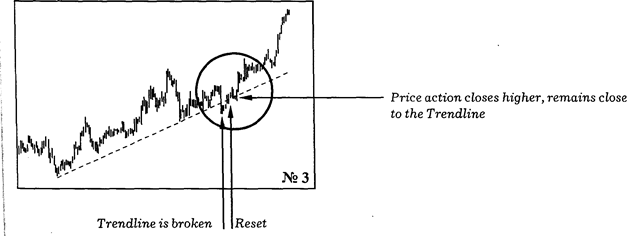
| A second concept included by Wyckoff in his analysis of trendlines, was the idea of a trendline that is "recovered". In other words, the concept that a breach of a trendline does not always automatically render that trendline invalid. Diagram 4 provides us with a great example of this. Market prices break this trendline but then continue to close consecutively higher and closer toward the trendline. Eventually prices break back above the trendline, retest the trendline and then continue up in the direction of the original trend. (See Diagram 3)
Trendlines are one of the most popular tools used to analyse prince action in trending markets. They alert you to changes in market direction and provide you with the valuable signals to buy and sell. The information they give you can be interpreted in an infinite number of ways, but armed with the basis principles, you can work effectively with this analysis and eventually add your own personal touch.
| e eventually
| — в конце концов
| |
| л touch
| — свое отношение
| |
| | | | | | | | |